
SY Holdings Group (SEHK:6069) Valuation After Expanding Guarantees to Back Supply Chain Finance Growth
SY Holdings Group (SEHK:6069) just doubled down on its core supply chain finance engine by extending and enlarging guarantees and loans to key affiliates through 2027, a balance sheet commitment big enough to trigger Hong Kong Listing Rules disclosure.
See our latest analysis for SY Holdings Group.
That backdrop helps explain why investors have largely leaned in this year, with the share price climbing strongly, reflected in a 57.72% year to date share price return and a 64.32% one year total shareholder return that suggests momentum is building rather than fading.
If this kind of financials driven growth story has your attention, it could be worth widening your search and seeing what else stands out in fast growing stocks with high insider ownership
Yet with the stock still trading at a steep discount to analyst targets despite rapid earnings growth, the key question now is whether this is a genuine mispricing or whether the market is already baking in future gains.
Price-to-Earnings of 25.5x: Is it justified?
On a trailing basis, SY Holdings Group trades on a 25.5x price-to-earnings multiple at HK$11.23, a level that screens as expensive rather than cheap.
The price-to-earnings ratio compares the current share price with the company’s earnings per share. It effectively shows how much investors are paying today for each unit of current profit. For a fast growing, asset light financial technology platform, this metric is often a key shorthand for how markets are pricing in the sustainability and pace of future earnings growth.
In SY Holdings Group’s case, the market is currently assigning a 25.5x price-to-earnings ratio. This is well above the estimated fair price-to-earnings ratio of 13.3x that our models suggest the market could gravitate toward over time. That premium also stands out sharply beside the Asian diversified financial industry average of 15.7x and a peer group average closer to 6x, implying investors are paying a substantial mark up versus both sector norms and local competition.
Explore the SWS fair ratio for SY Holdings Group
Result: Price-to-Earnings of 25.5x (OVERVALUED)
However, elevated valuation and reliance on sustained double digit growth mean that any slowdown in China’s supply chain financing demand could quickly puncture the current optimism.
Find out about the key risks to this SY Holdings Group narrative.
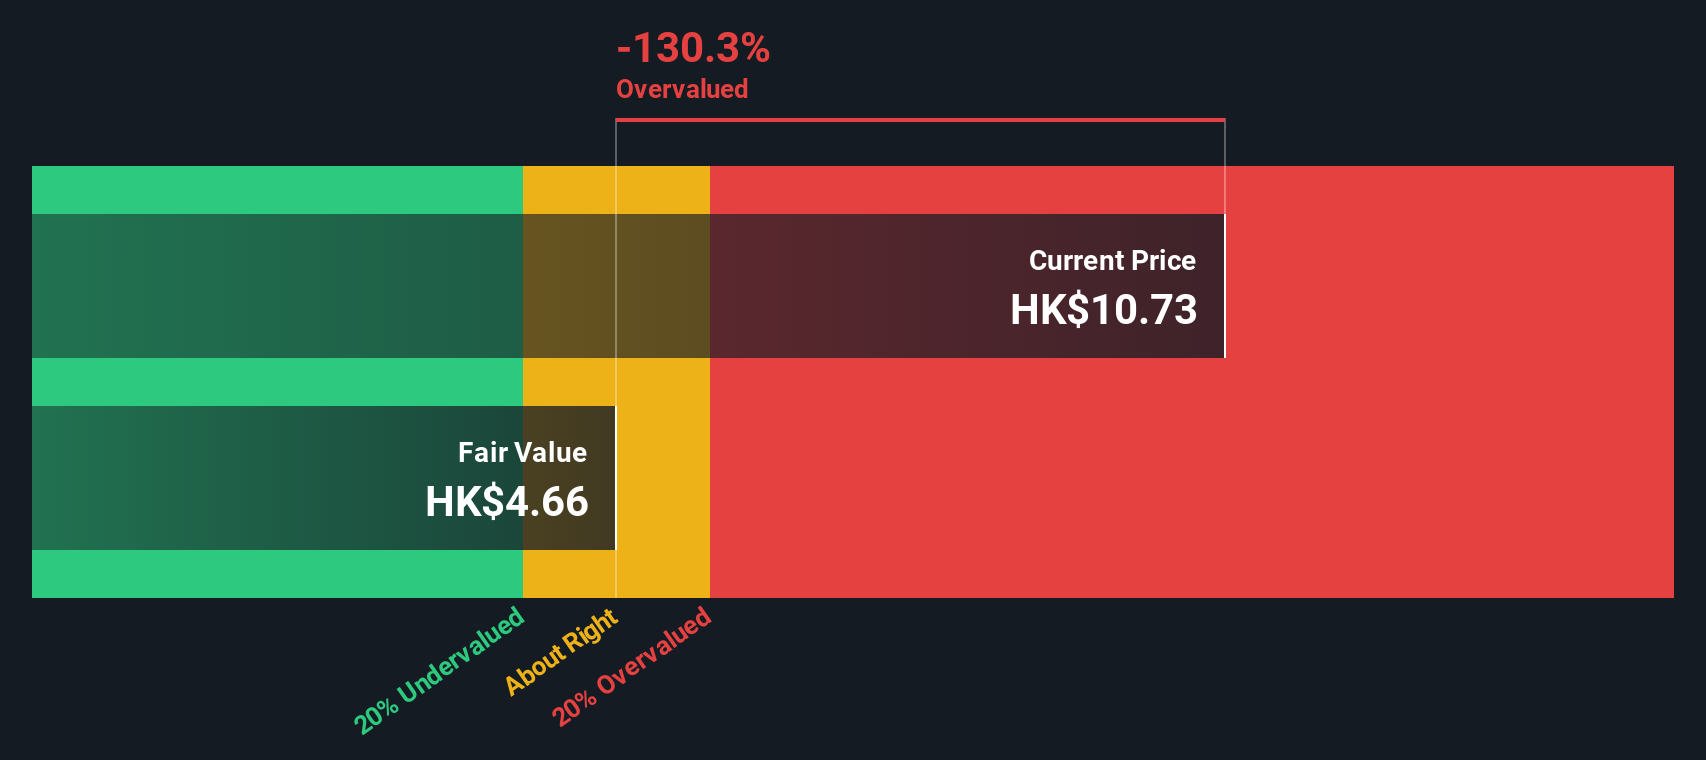
Another View: SWS DCF Model Signals Caution
Our DCF model paints a very different picture, putting fair value at around HK$4.71 versus the current HK$11.23 share price. This suggests the stock is materially overvalued. If cash flows fail to scale as expected, could today’s optimism unwind faster than many holders assume?
Look into how the SWS DCF model arrives at its fair value.
Simply Wall St performs a discounted cash flow (DCF) on every stock in the world every day (check out SY Holdings Group for example). We show the entire calculation in full. You can track the result in your watchlist or portfolio and be alerted when this changes, or use our stock screener to discover 913 undervalued stocks based on their cash flows. If you save a screener we even alert you when new companies match - so you never miss a potential opportunity.
Build Your Own SY Holdings Group Narrative
If you see the numbers differently or want to stress test the assumptions yourself, you can build a personalised view in just minutes: Do it your way.
A great starting point for your SY Holdings Group research is our analysis highlighting 3 key rewards and 1 important warning sign that could impact your investment decision.
Looking for more investment ideas?
Before you move on, secure your next opportunity with targeted stock ideas on Simply Wall St’s Screener, so strong candidates never slip past your radar.
- Capture potential mispricings by scanning these 913 undervalued stocks based on cash flows where solid cash flows could be hiding behind temporarily weak sentiment.
- Ride powerful technology shifts by zeroing in on these 24 AI penny stocks that may benefit most as AI adoption accelerates globally.
- Strengthen your income stream by reviewing these 12 dividend stocks with yields > 3% that can add dependable yield to a long term portfolio.
This article by Simply Wall St is general in nature. We provide commentary based on historical data and analyst forecasts only using an unbiased methodology and our articles are not intended to be financial advice. It does not constitute a recommendation to buy or sell any stock, and does not take account of your objectives, or your financial situation. We aim to bring you long-term focused analysis driven by fundamental data. Note that our analysis may not factor in the latest price-sensitive company announcements or qualitative material. Simply Wall St has no position in any stocks mentioned.
Have feedback on this article? Concerned about the content? Get in touch with us directly. Alternatively, email editorial-team@simplywallst.com