
Is Venture Global’s Recent 73.5% Slide Creating a Long Term Opportunity?
- If you are looking at Venture Global and wondering whether the recent slump has quietly turned it into a value play, you are not alone.
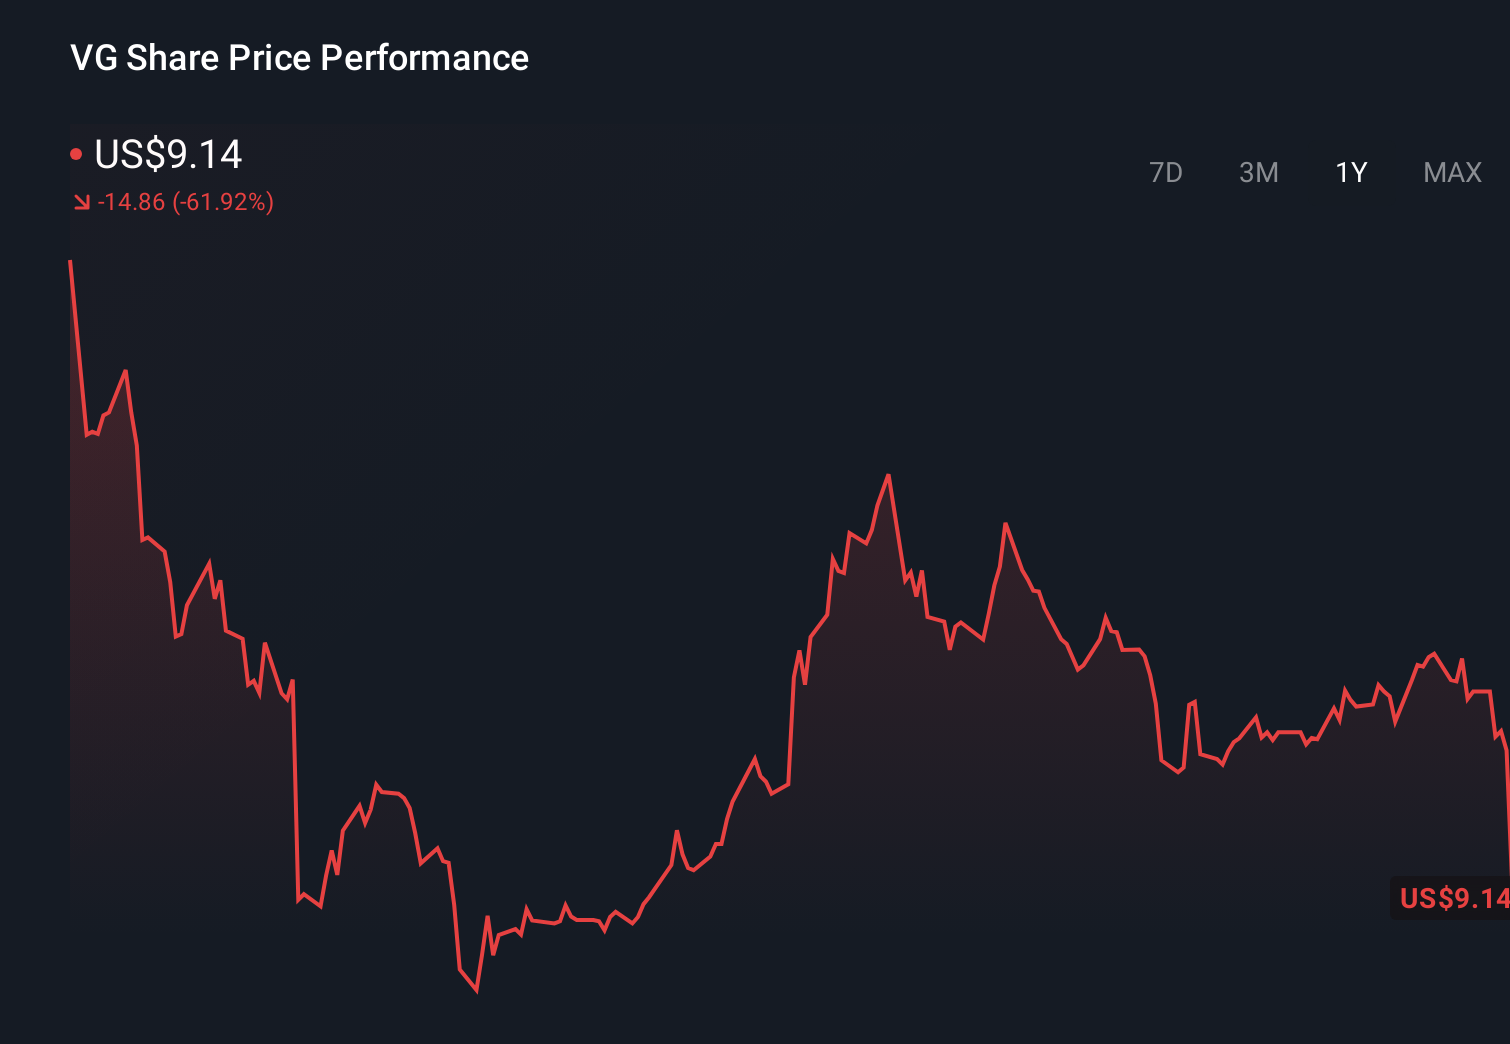
- The stock has bounced 3.3% over the last week even after a steep 12.4% drop over 30 days and a bruising 73.5% slide year to date. This combination often signals the market is rapidly reassessing both its growth prospects and risk profile.
- Recent headlines around Venture Global have centered on shifting investor sentiment in the LNG and broader energy space, with capital rotating toward names seen as having clearer long term project visibility and funding. At the same time, ongoing debates about US export policy and infrastructure timelines have kept volatility high for companies like Venture Global that are closely tied to these macro themes.
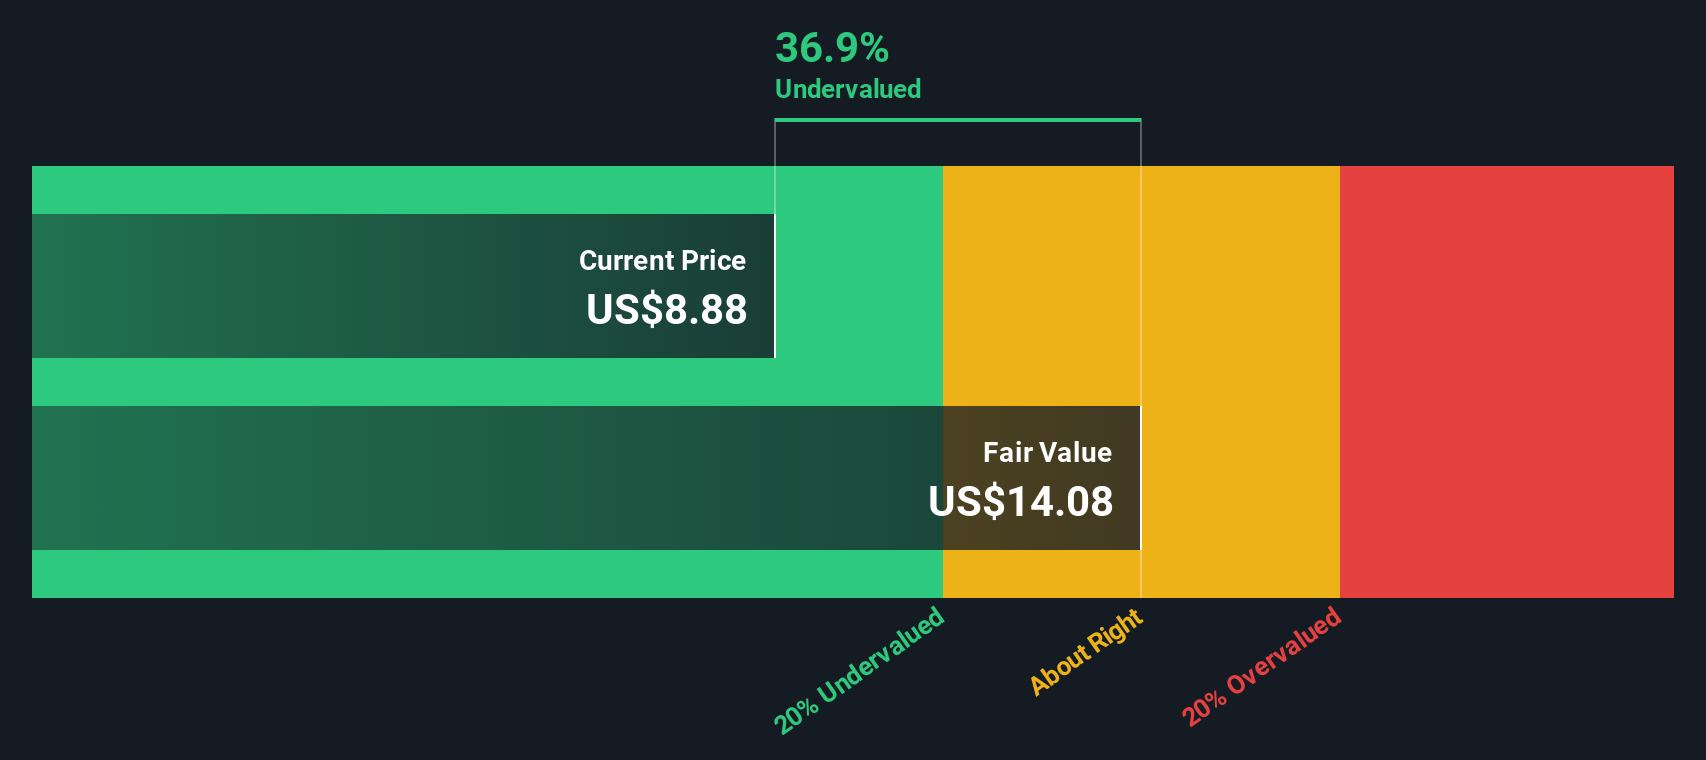
- Right now, Venture Global scores a 3 out of 6 on our valuation checks, which means it looks undervalued on half of the key metrics we track, but not compellingly cheap across the board. Next, we will break down what that score really means by walking through different valuation approaches, and then finish with a more complete way to think about what the market might be missing on this stock.
Approach 1: Venture Global Discounted Cash Flow (DCF) Analysis
A Discounted Cash Flow model estimates what a company is worth today by projecting its future cash flows and discounting them back to the present. For Venture Global, the 2 Stage Free Cash Flow to Equity model starts with its latest twelve month free cash flow of roughly $10.7 billion in the red, highlighting how capital intensive and early stage its build out still is.
Analysts see cash flows remaining negative through at least 2028, before turning positive in 2029 at about $0.77 billion and then gradually rising as Simply Wall St extrapolates the later years. These projections, all in $, are then discounted back to today to estimate what that stream is worth in present value terms.
On this basis, the DCF model points to an intrinsic value of around $1.48 per share for NYSE:VG. Compared with the current share price, that implies the stock is roughly 329.1% above where the cash flow math suggests it should trade, indicating that a lot of optimism about project execution may already be reflected in the price.
Result: OVERVALUED
Our Discounted Cash Flow (DCF) analysis suggests Venture Global may be overvalued by 329.1%. Discover 913 undervalued stocks or create your own screener to find better value opportunities.
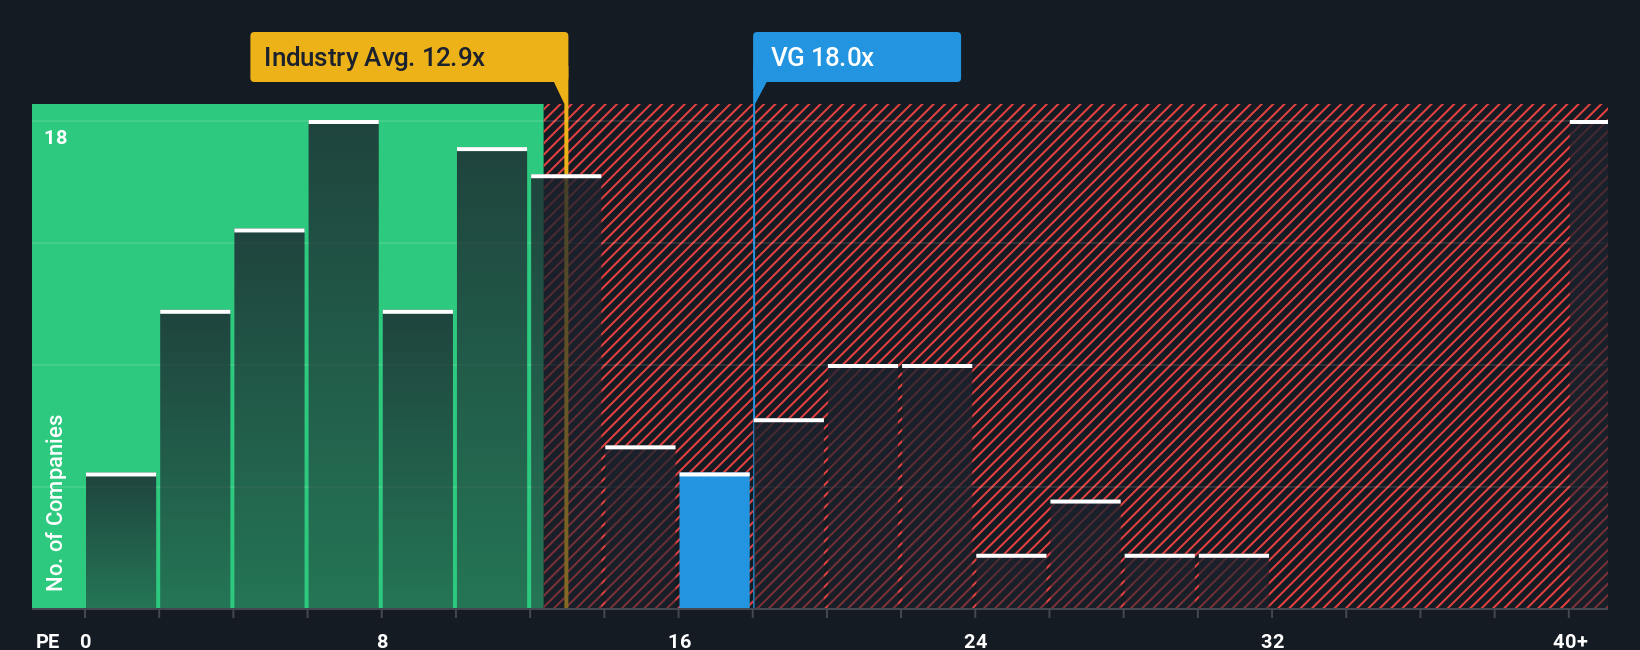
Approach 2: Venture Global Price vs Earnings
For companies that are already generating profits, the Price to Earnings, or PE, ratio is often the most intuitive way to think about value because it links what you pay directly to the earnings the business is producing today.
In general, faster growth and lower perceived risk justify a higher PE multiple, while slower growth, more leverage or lumpier earnings usually warrant a discount. So the question is not just whether a PE is high or low in isolation, but whether it makes sense given the company’s outlook and risk profile.
Venture Global currently trades on a PE of 7.53x, which is well below the Oil and Gas industry average of about 12.77x and the broader peer group average of roughly 22.61x. Simply Wall St’s proprietary Fair Ratio, which estimates what PE the stock should trade on after factoring in its earnings growth, industry, margins, market cap and risk profile, comes out at 12.35x. This Fair Ratio is more informative than a simple peer or industry comparison because it adjusts for Venture Global’s specific fundamentals rather than assuming it deserves a generic sector multiple. With the actual PE sitting materially below the 12.35x Fair Ratio, Venture Global appears attractively priced on earnings.
Result: UNDERVALUED
PE ratios tell one story, but what if the real opportunity lies elsewhere? Discover 1462 companies where insiders are betting big on explosive growth.
Upgrade Your Decision Making: Choose your Venture Global Narrative
Earlier we mentioned that there is an even better way to understand valuation, so let us introduce you to Narratives, a simple way to connect your view of Venture Global’s story with the numbers that sit behind its fair value. A Narrative is your own structured perspective on a company, where you spell out what you believe about its future revenues, earnings and margins, then link that story to a financial forecast and, ultimately, to a fair value estimate. On Simply Wall St, Narratives live in the Community page, where millions of investors can easily build, share and compare these story driven valuations. Investors can then decide whether to buy or sell by comparing each Narrative’s Fair Value to the current market price. Because Narratives automatically refresh when new information arrives, such as earnings releases or major news, your investment thesis stays alive rather than frozen in time. For Venture Global, for example, one investor might build a very optimistic Narrative around rapid LNG export growth, while another assumes slower project ramps and stricter regulation, leading to very different fair values from the same starting stock price.
Do you think there's more to the story for Venture Global? Head over to our Community to see what others are saying!
This article by Simply Wall St is general in nature. We provide commentary based on historical data and analyst forecasts only using an unbiased methodology and our articles are not intended to be financial advice. It does not constitute a recommendation to buy or sell any stock, and does not take account of your objectives, or your financial situation. We aim to bring you long-term focused analysis driven by fundamental data. Note that our analysis may not factor in the latest price-sensitive company announcements or qualitative material. Simply Wall St has no position in any stocks mentioned.
Have feedback on this article? Concerned about the content? Get in touch with us directly. Alternatively, email editorial-team@simplywallst.com