
NTT UD REIT Investment (TSE:8956): Valuation Check After New Buyback and Unit Cancellation Plan
NTT UD REIT Investment (TSE:8956) just doubled down on unitholders, with its board approving a buyback and cancellation plan that targets roughly 3% of units, funded from existing cash resources.
See our latest analysis for NTT UD REIT Investment.
The buyback decision comes after a steady run, with the share price delivering a double digit year to date return of 15.7% and a robust 24.18% one year total shareholder return. This suggests positive momentum despite weaker recent earnings.
If this kind of unitholder friendly move has you rethinking your REIT exposure, it might also be worth exploring fast growing stocks with high insider ownership for other ideas where insiders clearly believe in the story.
But with the unit price already near analyst targets and recent returns running hot, should investors treat this buyback fueled optimism as an entry point, or has the market already priced in NTT UD REIT's next leg of growth?
Price-to-Earnings of 24.2x: Is it justified?
On traditional metrics, NTT UD REIT Investment looks fully valued, with a 24.2x price-to-earnings multiple sitting above both peers and the broader JP REITs industry.
The price-to-earnings ratio compares the current unit price to the REIT's earnings per unit, effectively showing how much investors are willing to pay for each unit of profit. For a mature, income focused vehicle like a REIT, this multiple often reflects expectations for stability and incremental growth rather than rapid expansion.
In this case, the 24.2x price-to-earnings ratio is rich given that earnings have declined modestly by around 0.7% per year over the past five years, and margins have slipped from 36.1% to 31.8%. That combination suggests the market is paying up for perceived quality and stability despite the lack of clear profit growth, rather than for accelerating fundamentals.
Compared with the peer average of 19.3x and the JP REITs industry average of 20.9x, NTT UD REIT Investment commands a noticeably higher earnings multiple, indicating investors are assigning a premium valuation relative to similar REITs.
See what the numbers say about this price — find out in our valuation breakdown.
Result: Price-to-Earnings of 24.2x (OVERVALUED)
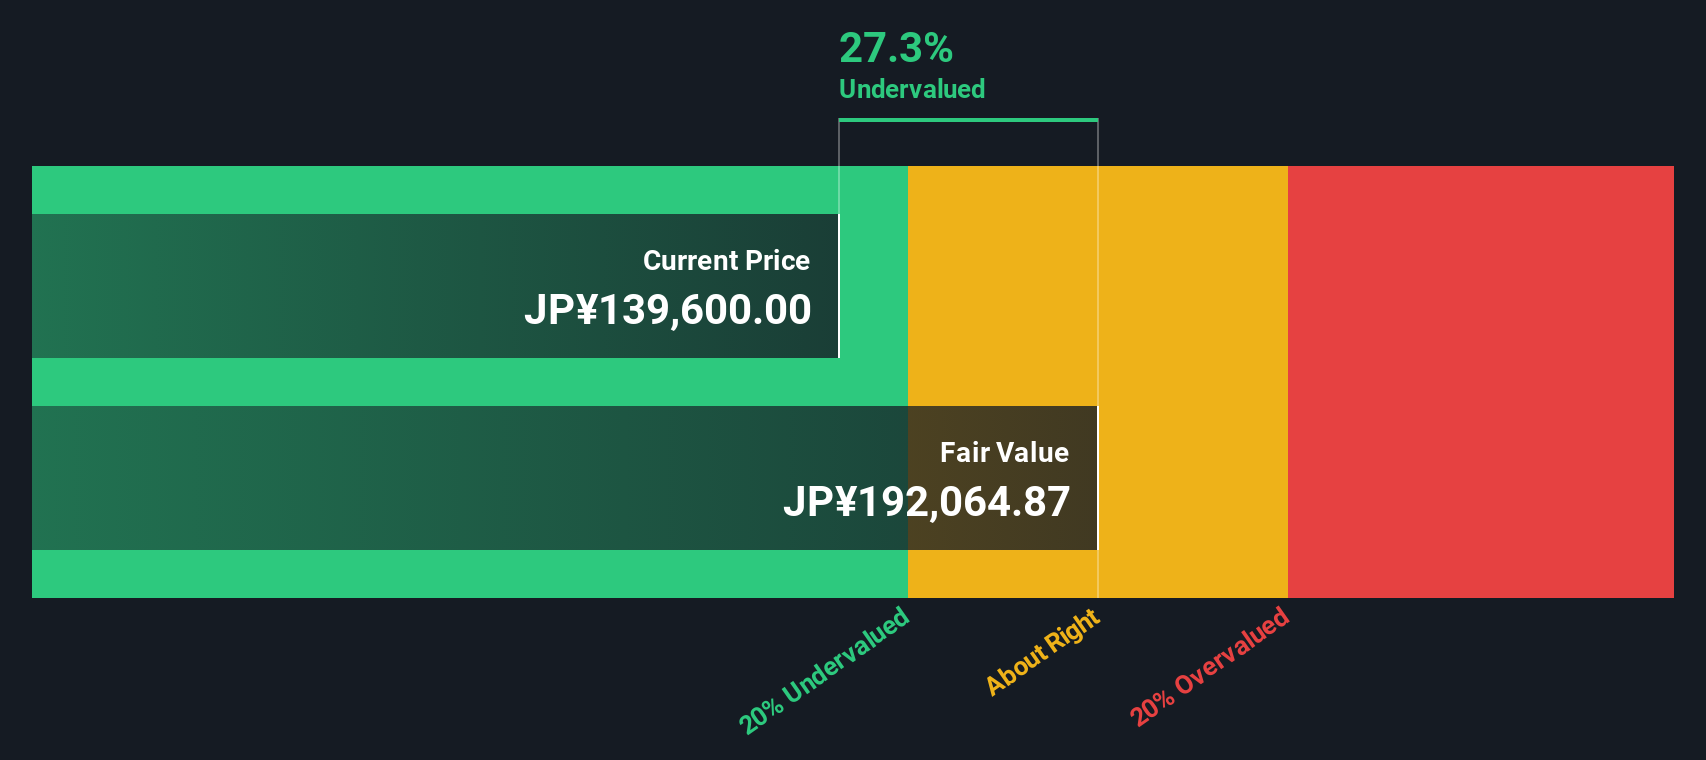
At the same time, our SWS DCF model suggests a very different picture, with a fair value estimate of ¥191,703.04 versus the last close of ¥139,300, implying the units trade at roughly a 27% discount. The DCF approach projects the REIT's future cash flows and discounts them back to today, aiming to capture the long term earning power of its portfolio rather than a single year's earnings.
For a seasoned, diversified Tokyo focused REIT with high quality earnings and experienced management, this kind of cash flow based lens can be particularly useful, especially when near term profit trends are muted but the asset base and income stream remain resilient.
Look into how the SWS DCF model arrives at its fair value.
Result: DCF Fair value of ¥191,703.04 (UNDERVALUED)
However, slower income growth or a reversal in Tokyo office and residential demand could challenge the premium valuation and undermine the bullish cash flow story.
Find out about the key risks to this NTT UD REIT Investment narrative.
Another View: Cash Flows Point to Hidden Value
While the 24.2x price-to-earnings multiple looks stretched, our SWS DCF model tells a different story. It flags NTT UD REIT Investment as around 27% undervalued versus its estimated fair value of ¥191,703.04. If earnings look soft but cash flows are solid, could patient investors be getting a quiet bargain?
Look into how the SWS DCF model arrives at its fair value.
Simply Wall St performs a discounted cash flow (DCF) on every stock in the world every day (check out NTT UD REIT Investment for example). We show the entire calculation in full. You can track the result in your watchlist or portfolio and be alerted when this changes, or use our stock screener to discover 910 undervalued stocks based on their cash flows. If you save a screener we even alert you when new companies match - so you never miss a potential opportunity.
Build Your Own NTT UD REIT Investment Narrative
If you see the numbers differently or want to dig into the details yourself, you can quickly build your own view in minutes: Do it your way.
A great starting point for your NTT UD REIT Investment research is our analysis highlighting 1 key reward and 3 important warning signs that could impact your investment decision.
Ready for more investment ideas?
NTT UD REIT Investment may be compelling, but you will miss out on other timely opportunities if you stop your research here, so keep building your edge.
- Capture potential value before the crowd by scanning these 910 undervalued stocks based on cash flows that still trade below what their cash flows suggest they are worth.
- Ride structural shifts in medicine and diagnostics by targeting these 29 healthcare AI stocks using intelligent automation to reshape patient outcomes and operational efficiency.
- Strengthen your income stream by focusing on these 12 dividend stocks with yields > 3% offering yields above 3% with the potential to support long term total returns.
This article by Simply Wall St is general in nature. We provide commentary based on historical data and analyst forecasts only using an unbiased methodology and our articles are not intended to be financial advice. It does not constitute a recommendation to buy or sell any stock, and does not take account of your objectives, or your financial situation. We aim to bring you long-term focused analysis driven by fundamental data. Note that our analysis may not factor in the latest price-sensitive company announcements or qualitative material. Simply Wall St has no position in any stocks mentioned.
Have feedback on this article? Concerned about the content? Get in touch with us directly. Alternatively, email editorial-team@simplywallst.com