
Has Pool’s 30% Slide Created an Opportunity for Long Term Investors?
- Wondering if Pool at around $232 a share is a bargain in disguise or a value trap? This breakdown will walk you through what the market might be getting wrong.
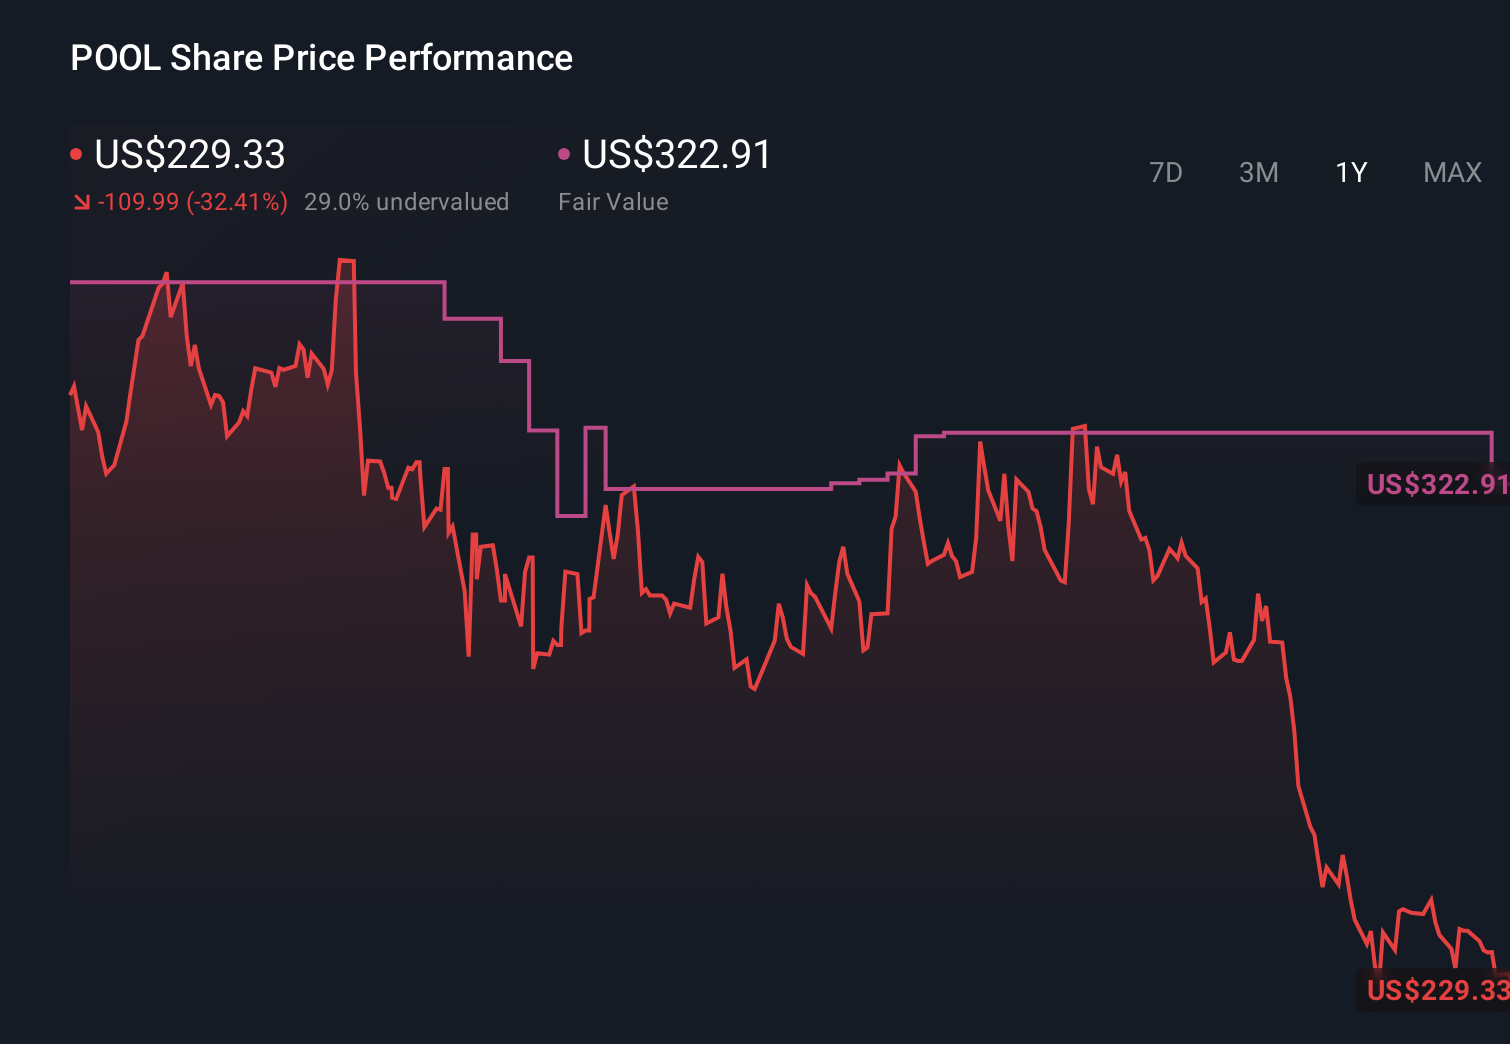
- The stock is down about 2.5% over the last week and 3.2% over the last month. More strikingly, it has fallen roughly 30.2% year to date and 32.1% over the last year, resetting expectations and risk perceptions in a big way.
- Recent headlines have focused on a cooler housing and renovation backdrop, with analysts debating how much of Pool's pandemic era demand was pulled forward and how sustainable its long term growth really is. At the same time, commentary around consumer spending and outdoor living trends has kept the story on investors' radar as they reassess what a "normal" earnings and cash flow profile looks like for the business.
- Right now, Pool scores a 4/6 on our valuation checks. You can explore this in detail via our valuation score. Next, we will unpack what different valuation approaches say about that score, before finishing with an even more intuitive way to think about what the stock is really worth.
Find out why Pool's -32.1% return over the last year is lagging behind its peers.
Approach 1: Pool Discounted Cash Flow (DCF) Analysis
A Discounted Cash Flow model estimates what a company is worth today by projecting the cash it can generate in the future and then discounting those cash flows back to their value in today’s dollars.
For Pool, the latest twelve month Free Cash Flow is about $396.6 million. Analysts provide detailed forecasts for the next few years, and beyond that Simply Wall St extrapolates the trend. Under this two stage Free Cash Flow to Equity model, Pool’s FCF is projected to rise to roughly $626.6 million by 2035, based on the model’s assumption of steady, mid single digit annual growth as the business matures.
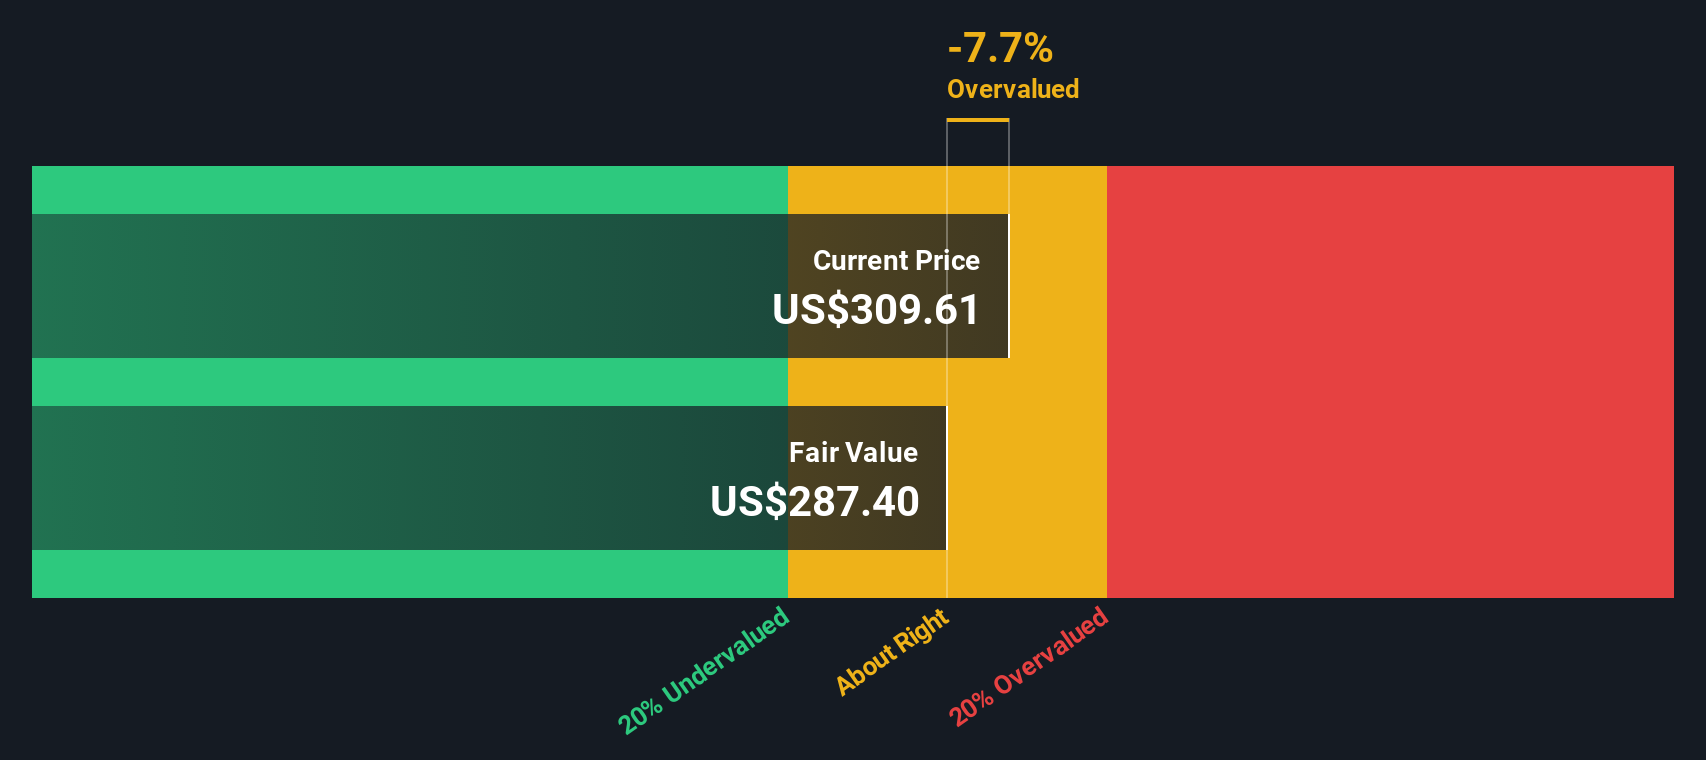
When all those future cash flows are discounted back, the model arrives at an intrinsic value of about $303 per share. Compared with the current share price around $232, this particular DCF model output indicates the stock is roughly 23.4% below that intrinsic value estimate.
Result: UNDERVALUED (according to this DCF model)
Our Discounted Cash Flow (DCF) analysis suggests Pool is undervalued by 23.4%. Track this in your watchlist or portfolio, or discover 898 more undervalued stocks based on cash flows.
Approach 2: Pool Price vs Earnings
For profitable companies like Pool, the price to earnings, or PE, ratio is a useful yardstick because it links what investors pay directly to the profits the business generates today. In general, faster expected growth and lower perceived risk justify a higher PE, while slower growth and higher uncertainty usually demand a lower, more conservative multiple.
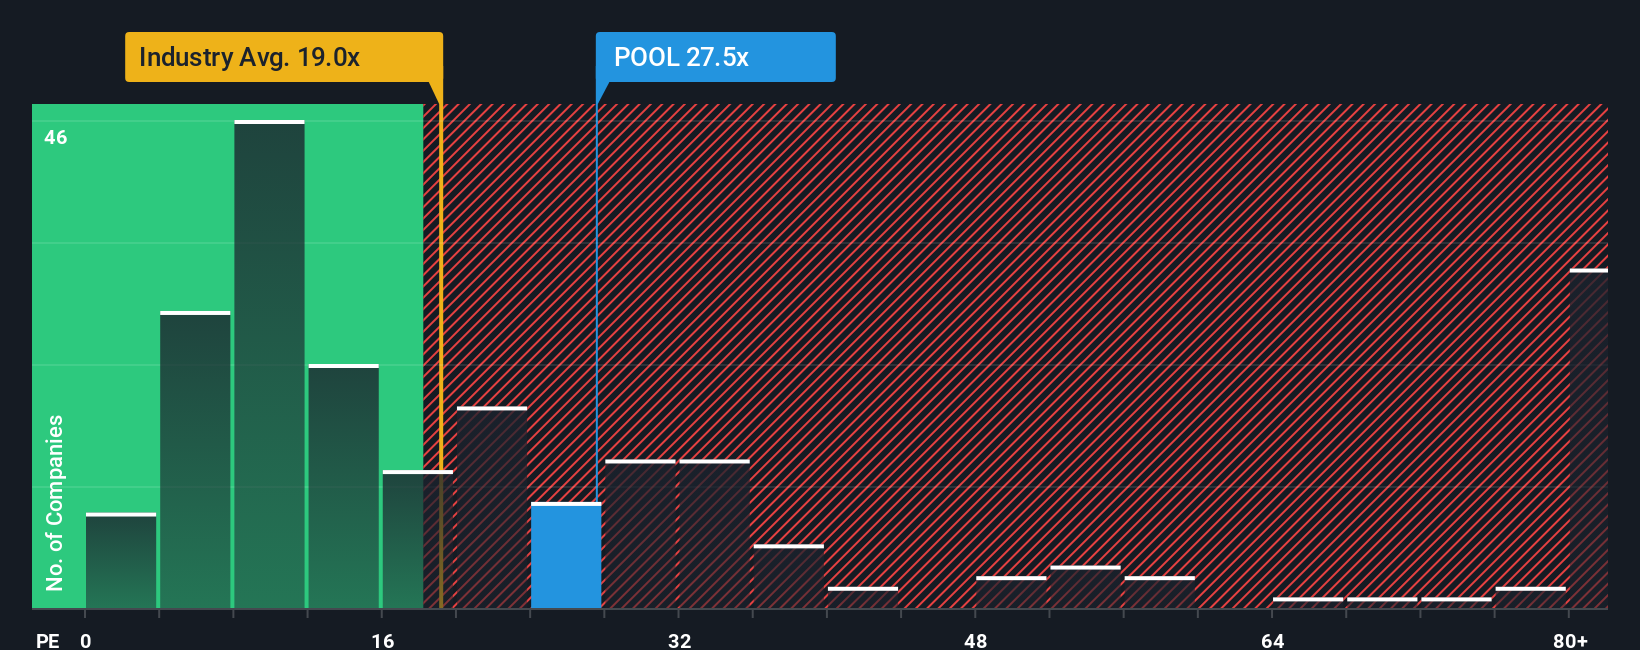
Pool currently trades at about 21.1x earnings. That sits above the broader Retail Distributors industry average of roughly 18.0x, but well below the peer group average near 39.1x, suggesting investors are giving Pool some credit for its quality and track record, but not pricing it as aggressively as the highest growth names.
Simply Wall St also calculates a Fair Ratio of around 15.4x, a proprietary estimate of what PE might be appropriate given Pool’s earnings growth profile, margins, industry, market cap and risk factors. This tailored yardstick is more informative than blunt peer or industry comparisons because it adjusts for the company’s specific strengths and vulnerabilities rather than assuming all retailers deserve the same multiple. With Pool’s current PE of 21.1x sitting meaningfully above the 15.4x Fair Ratio, the shares look slightly expensive on this framework.
Result: OVERVALUED
PE ratios tell one story, but what if the real opportunity lies elsewhere? Discover 1457 companies where insiders are betting big on explosive growth.
Upgrade Your Decision Making: Choose your Pool Narrative
Earlier we mentioned that there is an even better way to understand valuation, so let us introduce you to Narratives, a simple tool on Simply Wall St’s Community page that lets you turn your view of Pool’s future revenue, earnings, and margins into a clear financial forecast, link that forecast to a Fair Value, and then compare it to today’s share price to consider whether you think Pool could be undervalued or overvalued, with the Narrative automatically updating as new news or earnings arrive so different investors can express very different stories. For example, some investors may hold a bullish view that Pool merits a valuation closer to the highest recent fair value estimate around $375 per share, based on expectations that Sun Belt migration and recurring maintenance demand will support growth. Others may take a more cautious stance and see fair value nearer the low end around $285 per share, citing potential housing and competitive headwinds that could affect margins and the valuation multiple.
Do you think there's more to the story for Pool? Head over to our Community to see what others are saying!
This article by Simply Wall St is general in nature. We provide commentary based on historical data and analyst forecasts only using an unbiased methodology and our articles are not intended to be financial advice. It does not constitute a recommendation to buy or sell any stock, and does not take account of your objectives, or your financial situation. We aim to bring you long-term focused analysis driven by fundamental data. Note that our analysis may not factor in the latest price-sensitive company announcements or qualitative material. Simply Wall St has no position in any stocks mentioned.
Have feedback on this article? Concerned about the content? Get in touch with us directly. Alternatively, email editorial-team@simplywallst.com