
Has Markel Group’s Recent 27% Rally Already Priced In Future Growth?
- Wondering if Markel Group at around $2,180 a share is still a smart buy or if the easy money has already been made? Let us unpack what the current price is really baking in.
- The stock has climbed 1.0% over the last week, 7.3% over the past month, and is up 27.1% year to date, with a strong 25.7% gain over the last year and a hefty 120.1% over five years. This naturally raises questions about how much upside is left.
- Recent headlines have highlighted Markel Group’s ongoing evolution as a diversified insurance and investment holding company. Investors are paying close attention to how its specialty insurance operations and investment portfolio are being repositioned. Together, these developments have helped shape the market’s perception of its long term growth and risk profile, contributing to those strong multi year returns.
- Despite that performance, our framework gives Markel Group a valuation score of 0/6, suggesting the stock does not screen as undervalued on any of our standard checks. Next, we will dig into the different valuation methods and then finish by looking at an even better way to think about what the market might be missing.
Markel Group scores just 0/6 on our valuation checks. See what other red flags we found in the full valuation breakdown.
Approach 1: Markel Group Excess Returns Analysis
The Excess Returns model looks at how effectively Markel Group turns shareholder capital into profits, then compares those returns to the cost of that equity. In simple terms, it asks whether the company is earning enough on each dollar of book value to justify today’s share price.
For Markel Group, Book Value is estimated at $1,429.48 per share, rising to a Stable Book Value of $1,620.55 per share, based on expectations from 3 analysts. Stable EPS is projected at $120.85 per share, derived from weighted future Return on Equity estimates from 4 analysts. Against a Cost of Equity of $112.73 per share, this implies an Excess Return of only $8.12 per share, supported by an average Return on Equity of 7.46%.
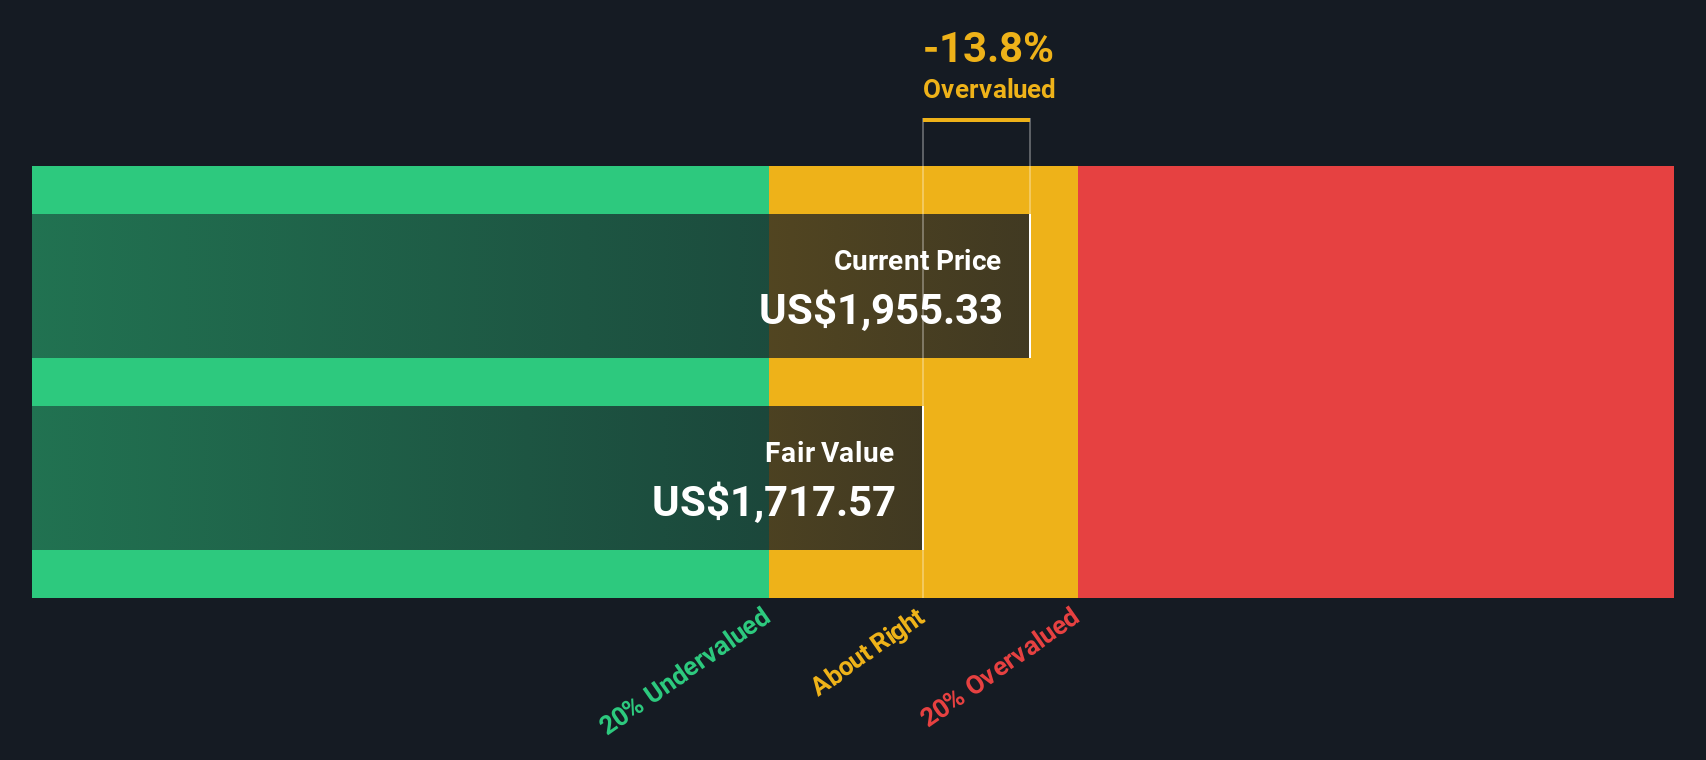
When these excess returns are projected forward and discounted, the model arrives at an intrinsic value of about $1,840 per share. With the stock trading around $2,180, the Excess Returns framework suggests it is roughly 18.6% above this estimate of intrinsic value.
Result: OVERVALUED
Our Excess Returns analysis suggests Markel Group may be overvalued by 18.6%. Discover 898 undervalued stocks or create your own screener to find better value opportunities.
Approach 2: Markel Group Price vs Earnings
For a consistently profitable company like Markel Group, the price to earnings ratio is a practical way to gauge how much investors are willing to pay for each dollar of current earnings. In general, faster expected earnings growth and lower perceived risk justify a higher PE, while slower growth or higher uncertainty should translate into a lower, more conservative multiple.
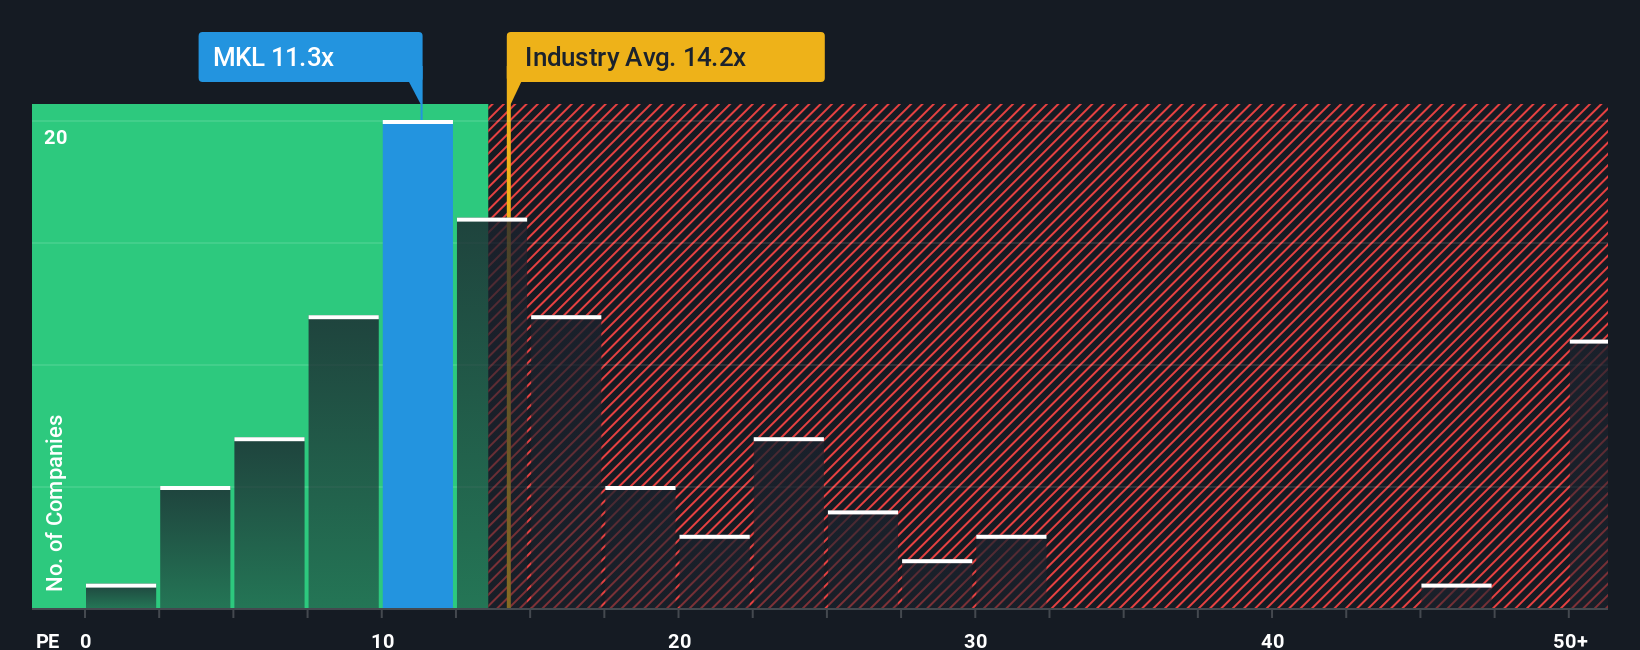
Markel currently trades at about 15.2x earnings, which is above both the Insurance industry average of roughly 13.3x and the peer group average of about 13.2x. On the surface, that premium might suggest the stock is getting a little rich relative to its sector. However, simple comparisons like these miss important nuances around Markel’s specific growth profile, margins and balance sheet strength.
That is where Simply Wall St’s Fair Ratio comes in. This is our estimate of what a reasonable PE should be for Markel, given its earnings growth outlook, profitability, risk factors, industry and market cap. For Markel, the Fair Ratio is around 12.7x, notably below the current 15.2x multiple. This gap indicates investors are paying more than what these fundamentals would typically support.
Result: OVERVALUED
PE ratios tell one story, but what if the real opportunity lies elsewhere? Discover 1458 companies where insiders are betting big on explosive growth.
Upgrade Your Decision Making: Choose your Markel Group Narrative
Earlier we mentioned that there is an even better way to understand valuation, so let us introduce you to Narratives, a simple way to connect your view of Markel Group’s future to a concrete forecast and Fair Value that you can compare with today’s price.
A Narrative is your story behind the numbers, where you spell out what you think will happen to Markel’s revenue, earnings and margins, and then link that story to an explicit estimate of Fair Value.
On Simply Wall St’s Community page, used by millions of investors, Narratives make this process accessible by guiding you from a company’s qualitative drivers, to a financial forecast, and finally to a Fair Value you can line up against the current share price to decide whether to buy, hold or sell.
Because Narratives update dynamically as new earnings, news or guidance emerge, your Markel view can evolve in real time. For example, a bullish investor might build a Narrative assuming Markel compounds book value faster and deserves a Fair Value well above $2,053 per share. In contrast, a more cautious investor might assume slower growth, more underwriting risk and a Fair Value comfortably below that level.
Do you think there's more to the story for Markel Group? Head over to our Community to see what others are saying!

This article by Simply Wall St is general in nature. We provide commentary based on historical data and analyst forecasts only using an unbiased methodology and our articles are not intended to be financial advice. It does not constitute a recommendation to buy or sell any stock, and does not take account of your objectives, or your financial situation. We aim to bring you long-term focused analysis driven by fundamental data. Note that our analysis may not factor in the latest price-sensitive company announcements or qualitative material. Simply Wall St has no position in any stocks mentioned.
Have feedback on this article? Concerned about the content? Get in touch with us directly. Alternatively, email editorial-team@simplywallst.com