
Is Emerson Electric Still Attractive After Automation Pivot And 89% Five Year Share Price Surge
- If you have been wondering whether Emerson Electric at around $134.99 is still a buy or if the value is already priced in, you are not alone. This article is written with that exact question in mind.
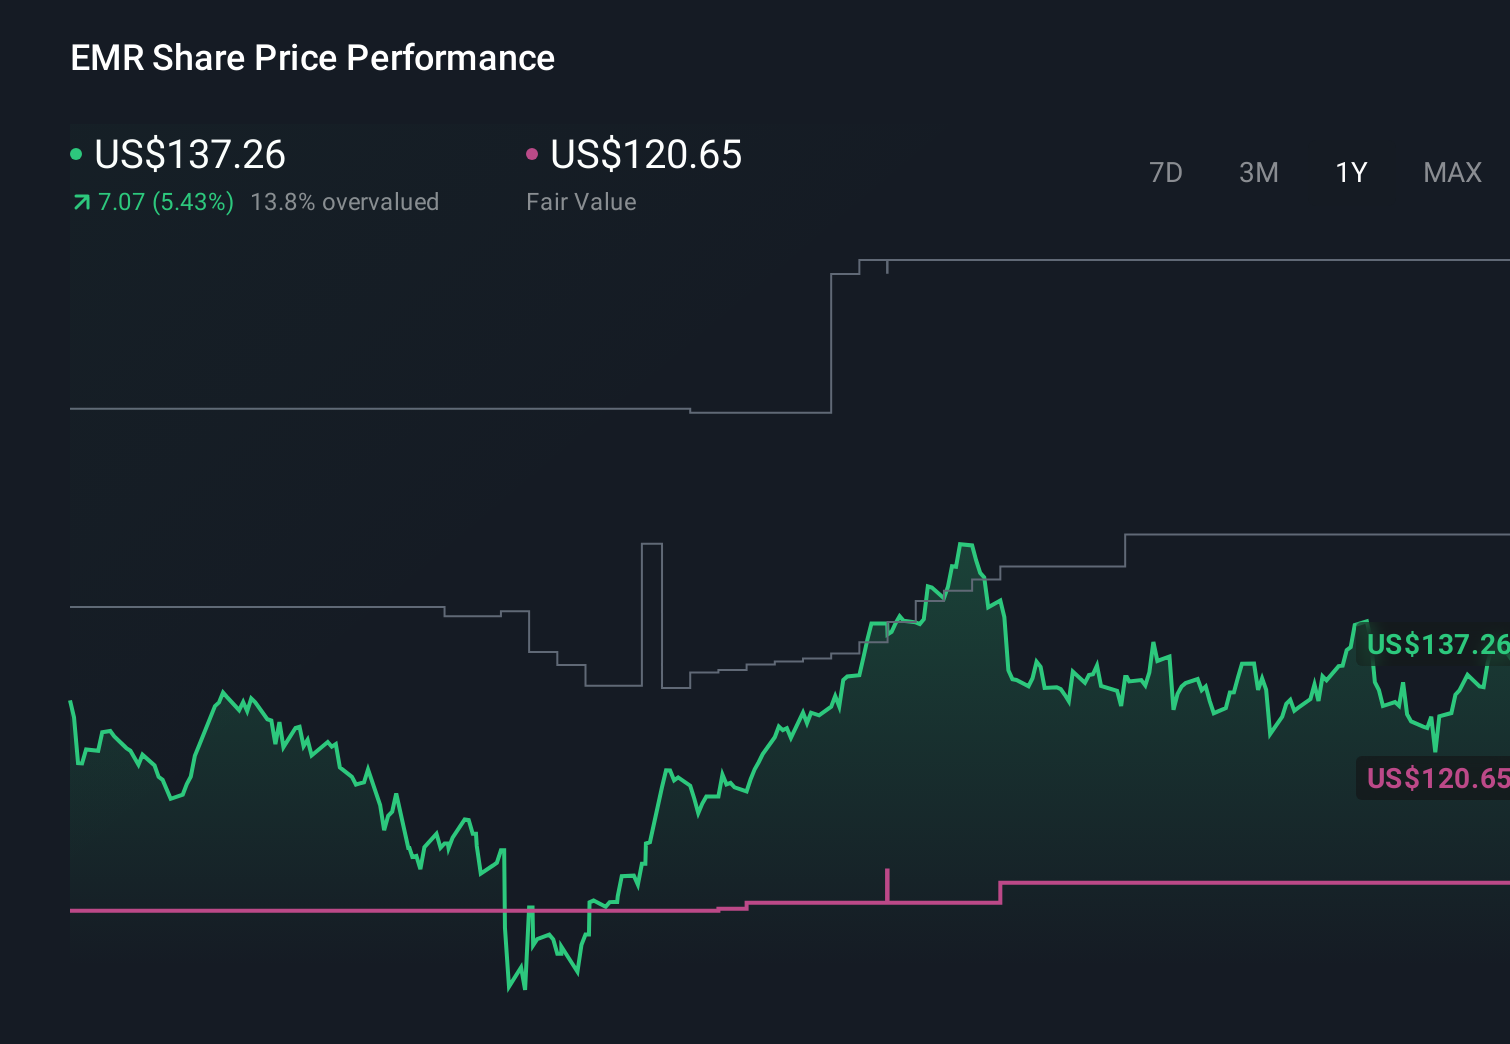
- The stock has climbed 0.7% over the last week, 5.3% over the past month, and is up 10.5% year to date, building on an 89.0% gain over five years that has reshaped how investors think about its risk and growth profile.
- Recent headlines have focused on Emerson doubling down on higher margin automation and software, including portfolio reshaping moves and strategic acquisitions that tilt the business toward faster growing, more tech driven segments. At the same time, divestitures of slower growth, more cyclical operations have helped clean up the story and may be part of what the market is responding to.
- Despite that backdrop, Emerson only scores a 3/6 valuation check score, suggesting some metrics still point to pockets of value. Next, we will unpack what different valuation approaches say about the stock today, and later in the article we will look at an even more useful way to think about its true worth.
Find out why Emerson Electric's 8.8% return over the last year is lagging behind its peers.
Approach 1: Emerson Electric Discounted Cash Flow (DCF) Analysis
A Discounted Cash Flow model estimates what a business is worth today by projecting the cash it can generate in the future and then discounting those cash flows back to the present.
For Emerson Electric, the latest twelve month free cash flow is about $2.7 billion. Analysts and internal estimates see this rising steadily, with projections reaching roughly $7.1 billion by 2029 and continuing to grow thereafter, based on a two stage Free Cash Flow to Equity framework. Earlier years rely on analyst forecasts, while later years are extrapolated to reflect a maturing but still expanding automation and software focused business.
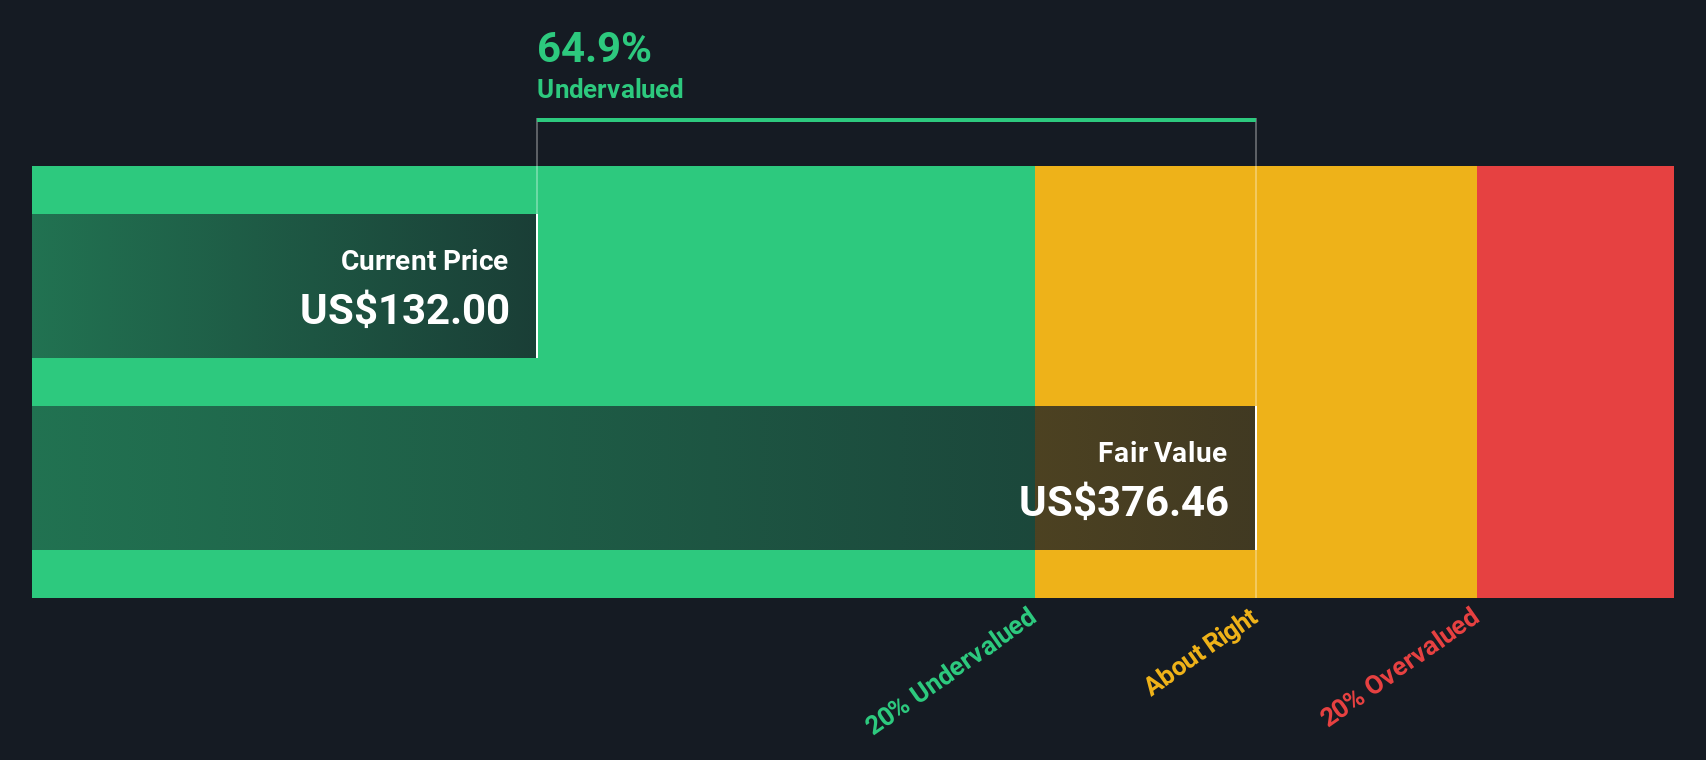
When all those future cash flows are discounted back to today, Simply Wall St’s DCF model arrives at an intrinsic value of about $227.67 per share. Compared with the recent share price around $134.99, the model implies the stock is trading at roughly a 40.7% discount to its estimated fair value. This indicates potential upside if these cash flow assumptions prove accurate.
Result: UNDERVALUED
Our Discounted Cash Flow (DCF) analysis suggests Emerson Electric is undervalued by 40.7%. Track this in your watchlist or portfolio, or discover 901 more undervalued stocks based on cash flows.
Approach 2: Emerson Electric Price vs Earnings
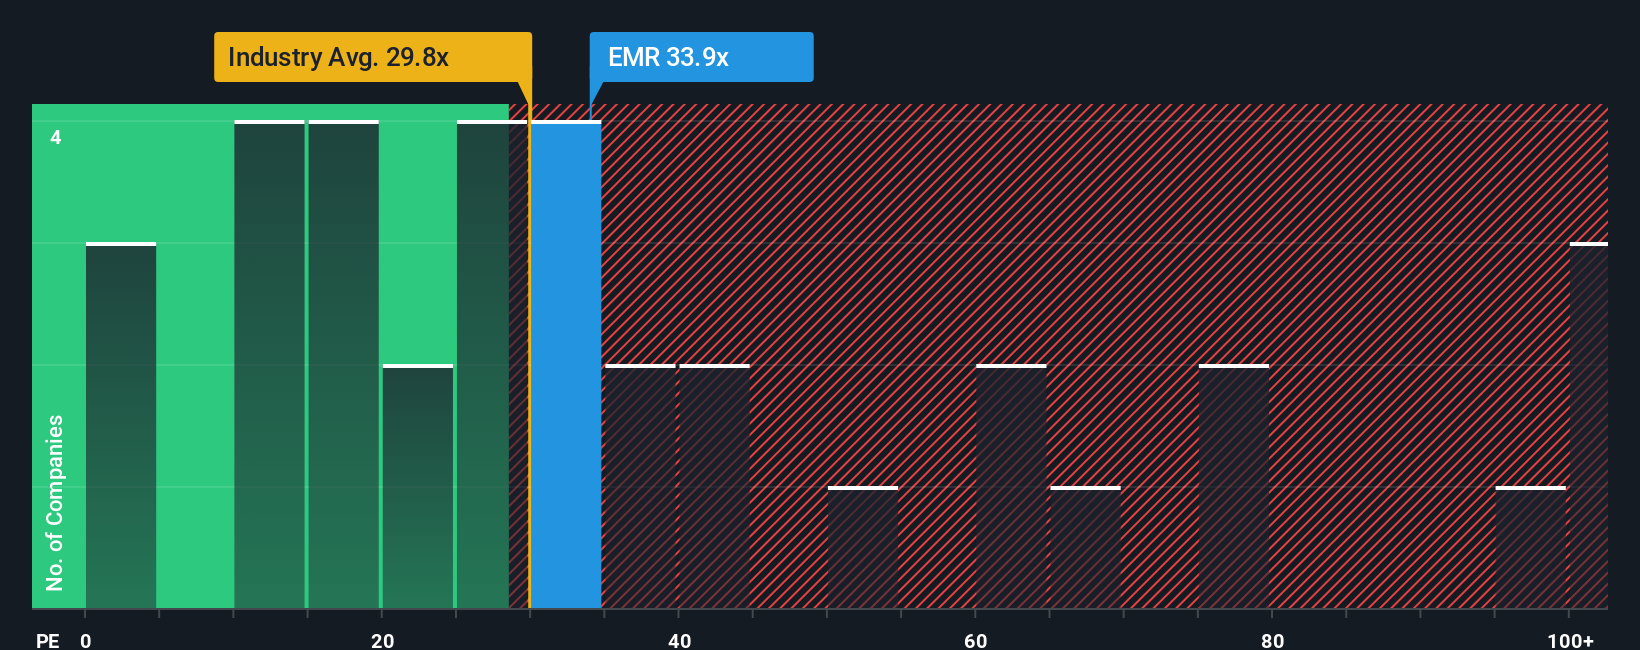
For profitable businesses like Emerson Electric, the Price to Earnings, or PE, ratio is a practical way to gauge how much investors are willing to pay today for each dollar of current earnings. Higher growth and lower perceived risk usually justify a higher PE, while slower or more volatile companies tend to trade on lower multiples.
Emerson currently trades on a PE of about 33.2x, which is slightly above the broader Electrical industry average of roughly 31.7x and below the peer group average of about 44.3x. To move beyond simple comparisons, Simply Wall St uses a proprietary metric called the Fair Ratio. This metric estimates what PE a company should reasonably trade at after accounting for its earnings growth outlook, industry dynamics, profit margins, market cap, and specific risk profile.
Because the Fair Ratio incorporates these fundamentals directly, it offers a more tailored benchmark than raw industry or peer averages, which can be skewed by outliers or different business mixes. For Emerson, the Fair Ratio is around 31.8x, modestly below the actual 33.2x. That gap suggests the shares are trading a bit richer than warranted on earnings alone.
Result: OVERVALUED
PE ratios tell one story, but what if the real opportunity lies elsewhere? Discover 1458 companies where insiders are betting big on explosive growth.
Upgrade Your Decision Making: Choose your Emerson Electric Narrative
Earlier we mentioned that there is an even better way to understand valuation, so let us introduce you to Narratives, a simple framework on Simply Wall St’s Community page where you connect your view of a company’s future with the numbers by telling a clear story about how revenue, earnings, and margins might evolve. You then link that forecast to a fair value, and compare it to today’s share price to decide whether to buy, hold, or sell, while the platform keeps your Narrative dynamically updated as new news and earnings arrive. For example, one Emerson Electric Narrative might lean into accelerating demand for digital automation, AI, and subscription software to justify a higher fair value closer to the most bullish analyst target around $185. Another more cautious Narrative could focus on integration risks, exposure to cyclical capex, and FX headwinds to support a lower fair value closer to the most bearish target near $111. This gives you a structured way to see which story, and which price, you actually believe.
Do you think there's more to the story for Emerson Electric? Head over to our Community to see what others are saying!
This article by Simply Wall St is general in nature. We provide commentary based on historical data and analyst forecasts only using an unbiased methodology and our articles are not intended to be financial advice. It does not constitute a recommendation to buy or sell any stock, and does not take account of your objectives, or your financial situation. We aim to bring you long-term focused analysis driven by fundamental data. Note that our analysis may not factor in the latest price-sensitive company announcements or qualitative material. Simply Wall St has no position in any stocks mentioned.
Have feedback on this article? Concerned about the content? Get in touch with us directly. Alternatively, email editorial-team@simplywallst.com