
Is Metaplanet’s Surging Share Price Still Supported by Its Fundamentals in 2025?
- If you are wondering whether Metaplanet is still a smart buy after its massive run up, or if you are arriving too late to the party, this breakdown will help you assess whether the current price makes sense.
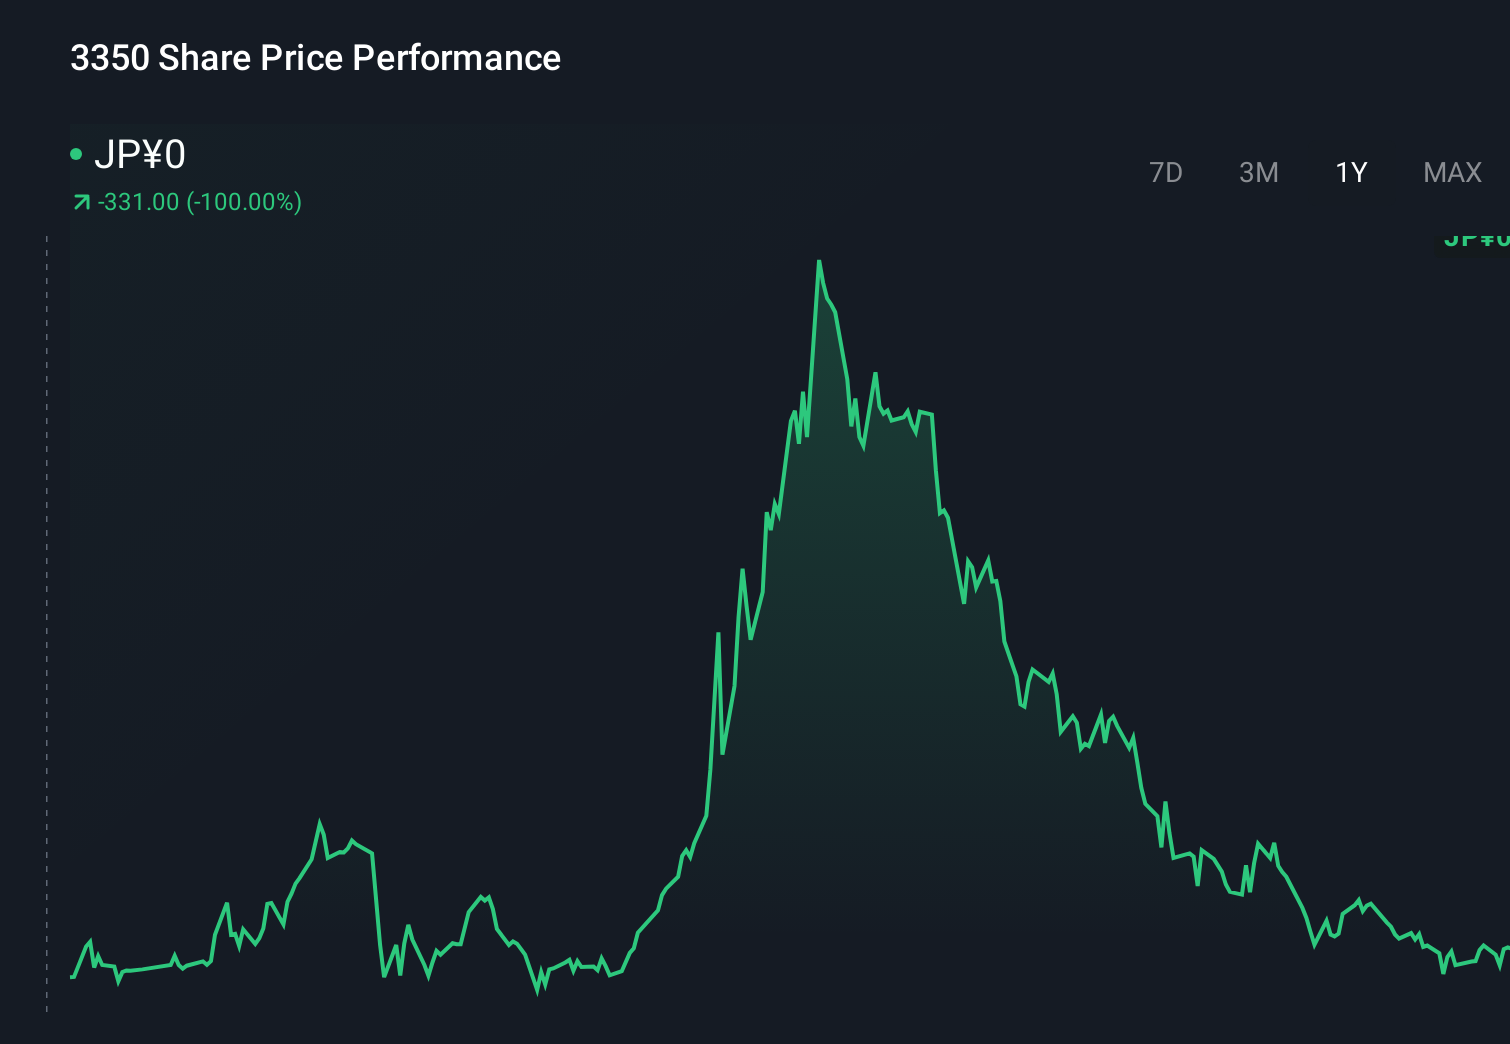
- The stock has been on a tear, climbing 15.8% over the last week, 29.1% over the past month, 29.0% year to date, and 43.2% over the past year. It has also recorded an 880.9% gain over three years and 723.2% over five years.
- These moves have not come out of nowhere. Metaplanet has regularly made headlines in Japan as a speculative, high beta name tied to shifting sentiment around digital assets and broader tech optimism. Coverage has focused on its bold positioning and perceived growth optionality, which together are drawing in momentum traders as well as longer term investors who are reassessing its upside and risk.
- Despite all that excitement, Metaplanet only scores 1 out of 6 on our undervaluation checks. In the sections that follow we will unpack what different valuation approaches suggest about the stock and, at the end, look at a more complete way to judge whether the current market price really reflects the full story.
Metaplanet scores just 1/6 on our valuation checks. See what other red flags we found in the full valuation breakdown.
Approach 1: Metaplanet Discounted Cash Flow (DCF) Analysis
The Discounted Cash Flow model estimates what a company is worth today by projecting its future cash flows and then discounting those back to a present value. For Metaplanet, this 2 stage Free Cash Flow to Equity model starts with last twelve month free cash flow of roughly ¥1.9 billion, and then applies modest growth assumptions over the next decade.
Analyst style estimates are only available for the near term, so later years are extrapolated based on Simply Wall St methodology. Under this approach, Metaplanet’s free cash flow is projected to rise to around ¥2.5 billion by 2035, with growth slowing over time as the business matures.
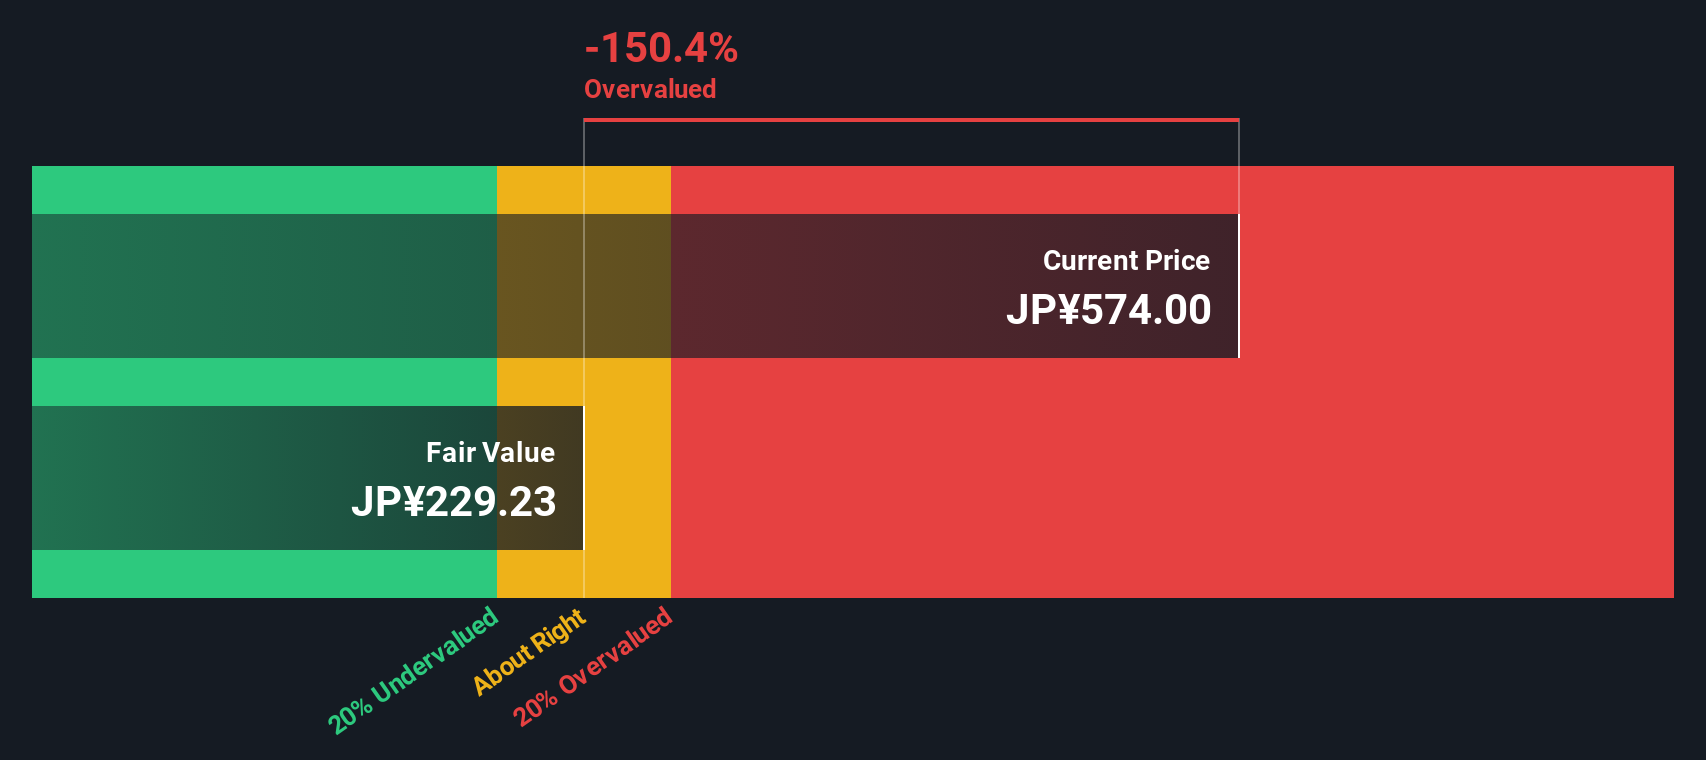
When those cash flows are discounted back, the model arrives at an intrinsic value of about ¥35.23 per share. Compared with the current market price, that implies the stock is roughly 1208.5% above its DCF based value, suggesting the market is pricing in far more optimistic outcomes than this conservative cash flow view supports.
Result: OVERVALUED
Our Discounted Cash Flow (DCF) analysis suggests Metaplanet may be overvalued by 1208.5%. Discover 902 undervalued stocks or create your own screener to find better value opportunities.
Approach 2: Metaplanet Price vs Earnings
For a profitable company like Metaplanet, the price to earnings, or PE, ratio is a practical way to gauge whether investors are paying a reasonable price for each unit of current earnings. In general, faster growing and lower risk businesses can justify a higher PE, while slower growth and higher uncertainty usually call for a lower, more conservative multiple.
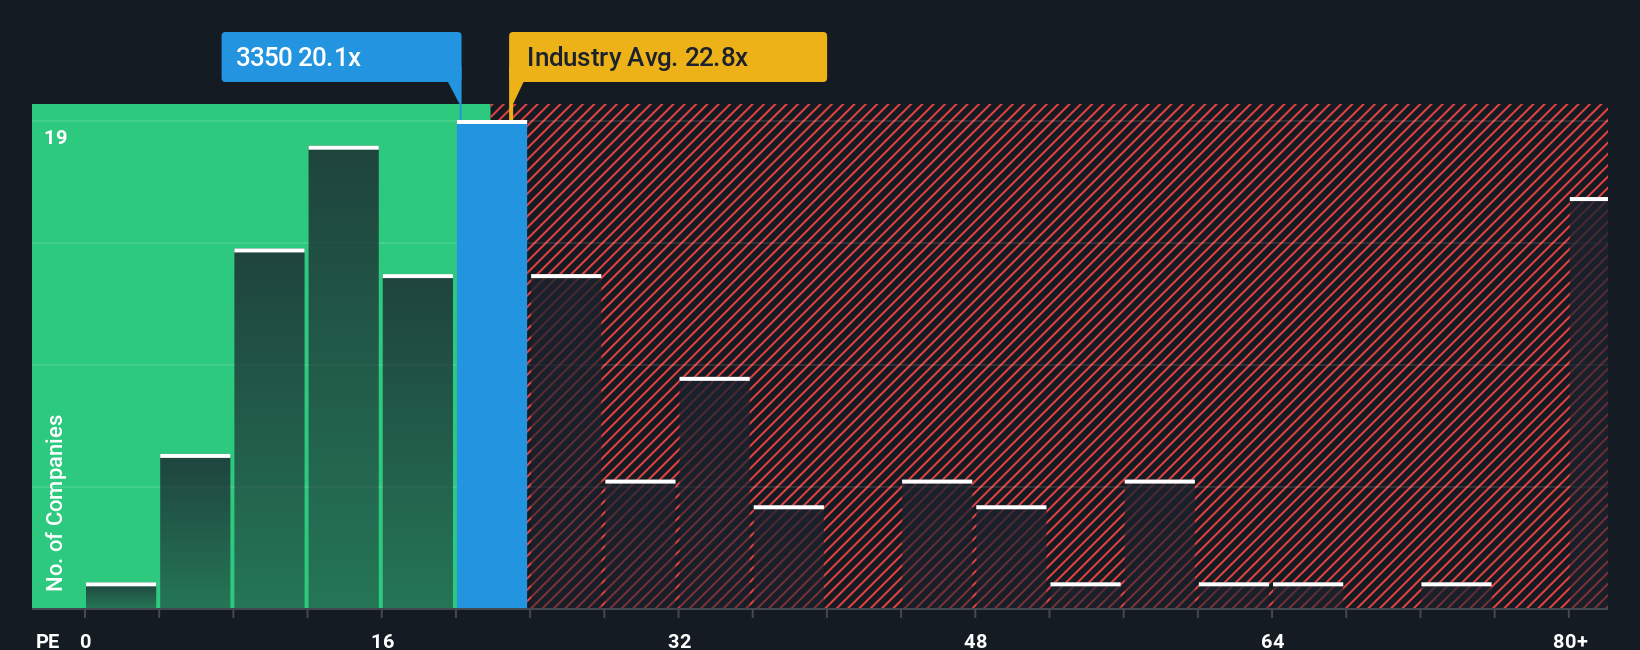
Metaplanet currently trades on a PE of about 26.0x. That sits above the Hospitality industry average of roughly 23.1x and also above the peer group average of around 18.4x, which on the surface can make the stock look expensive. However, simple comparisons like these ignore important company specific factors.
To address this, Simply Wall St uses a proprietary “Fair Ratio” that estimates what PE you would reasonably expect given Metaplanet’s earnings growth profile, its industry, profit margins, market cap and key risks. This more holistic lens suggests a Fair Ratio of about 45.8x, meaning that, once those drivers are considered, the market is actually assigning a much lower multiple than the model implies is justified. On this basis, Metaplanet screens as undervalued on earnings.
Result: UNDERVALUED
PE ratios tell one story, but what if the real opportunity lies elsewhere? Discover 1459 companies where insiders are betting big on explosive growth.
Upgrade Your Decision Making: Choose your Metaplanet Narrative
Earlier we mentioned that there is an even better way to understand valuation, so let us introduce you to Narratives, a simple framework that lets you attach a clear story to the numbers behind a company, including your view of its fair value and expectations for future revenue, earnings and margins. A Narrative links three things together: what you believe about a business, the financial forecast that belief implies, and the fair value that falls out of that forecast, so you can see in one place why your numbers make sense. Narratives are easy to use on Simply Wall St’s Community page, where millions of investors share and refine their views, and they are kept up to date as new information like earnings or major news arrives. This helps you decide when to buy or sell by continuously comparing your Narrative-based fair value with the current market price. For example, some Metaplanet Narratives on the Community page assume extremely aggressive growth and a very high fair value, while others build in slower expansion and a much lower fair value, reflecting how different investors can reasonably disagree about the same stock.
Do you think there's more to the story for Metaplanet? Head over to our Community to see what others are saying!
This article by Simply Wall St is general in nature. We provide commentary based on historical data and analyst forecasts only using an unbiased methodology and our articles are not intended to be financial advice. It does not constitute a recommendation to buy or sell any stock, and does not take account of your objectives, or your financial situation. We aim to bring you long-term focused analysis driven by fundamental data. Note that our analysis may not factor in the latest price-sensitive company announcements or qualitative material. Simply Wall St has no position in any stocks mentioned.
Have feedback on this article? Concerned about the content? Get in touch with us directly. Alternatively, email editorial-team@simplywallst.com