
Has AbbVie’s 2025 Surge Already Priced In Its Expanding Immunology and Oncology Pipeline?
- If you are wondering whether AbbVie is still attractive after its massive run, or if the value story has already played out, this breakdown outlines the key factors that can help you assess whether the current price makes sense.
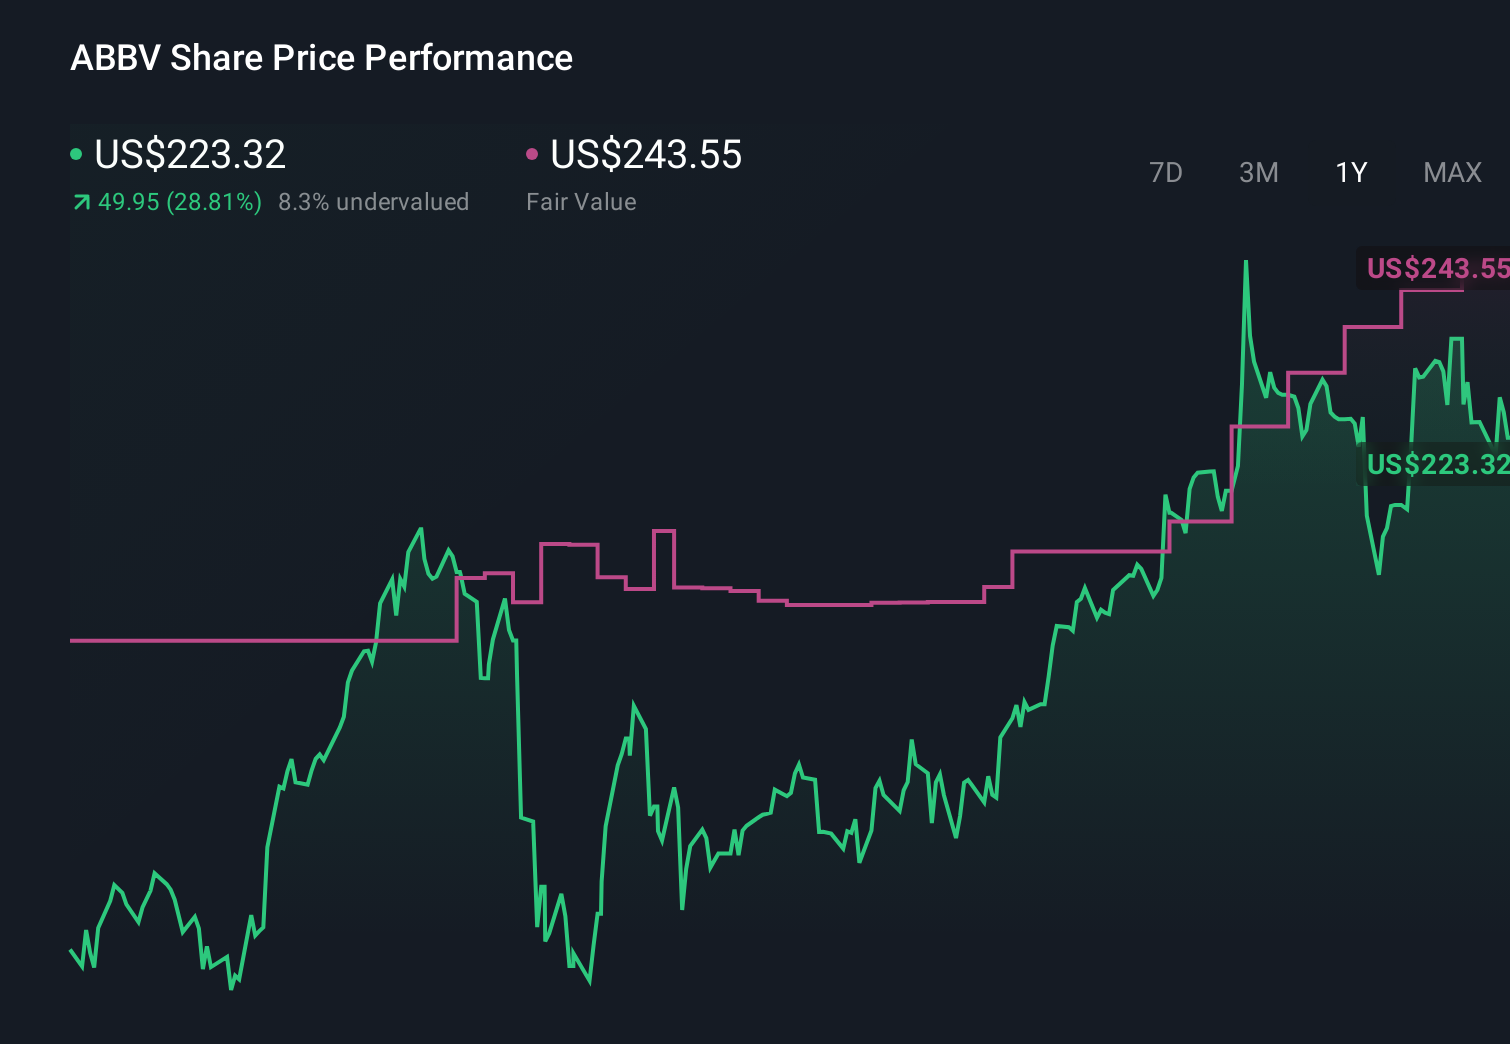
- The stock has climbed 28.1% year to date and 32.2% over the last year, with a 58.2% return over three years and 165.4% over five. This performance naturally raises questions about how much upside may remain from here.
- Recent headlines have focused on AbbVie's expanding immunology and oncology pipeline, strategic acquisitions designed to offset Humira erosion, and continued regulatory progress across key late stage assets. Together, these developments have contributed to a more optimistic market view of AbbVie's long term cash flows and have supported the share price strength.
- On our valuation checks, AbbVie scores a 4/6 value score. This suggests the stock appears reasonably attractive on several fronts, though not significantly undervalued on all of them. In the sections ahead, we unpack each valuation approach before finishing with a more practical way to think about AbbVie's underlying worth.
Approach 1: AbbVie Discounted Cash Flow (DCF) Analysis
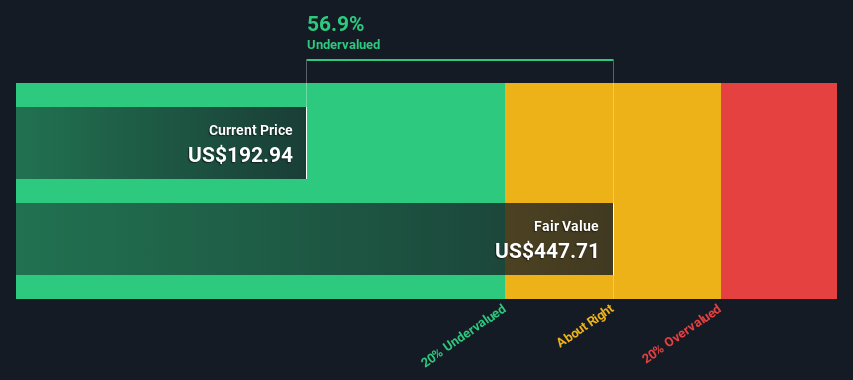
A Discounted Cash Flow model estimates what a company is worth by projecting the cash it can generate in the future and discounting those cash flows back to today in $ terms. For AbbVie, this 2 Stage Free Cash Flow to Equity model starts from last twelve months free cash flow of about $19.9 billion and then applies analyst forecasts and longer term assumptions.
Analysts project AbbVie’s annual free cash flow to rise into the mid to high $20 billion range over the next few years, with Simply Wall St extrapolating this trajectory further out based on slowing but still positive growth. By 2029, free cash flow is projected to reach roughly $31.8 billion, before moderating growth in the following years. These future cash flows are then discounted back to today to arrive at an estimated intrinsic value of about $422 per share.
Compared with the current share price, this DCF implies AbbVie trades at a 45.6% discount, which points to material upside if the cash flow path is broadly achieved.
Result: UNDERVALUED
Our Discounted Cash Flow (DCF) analysis suggests AbbVie is undervalued by 45.6%. Track this in your watchlist or portfolio, or discover 904 more undervalued stocks based on cash flows.
Approach 2: AbbVie Price vs Sales
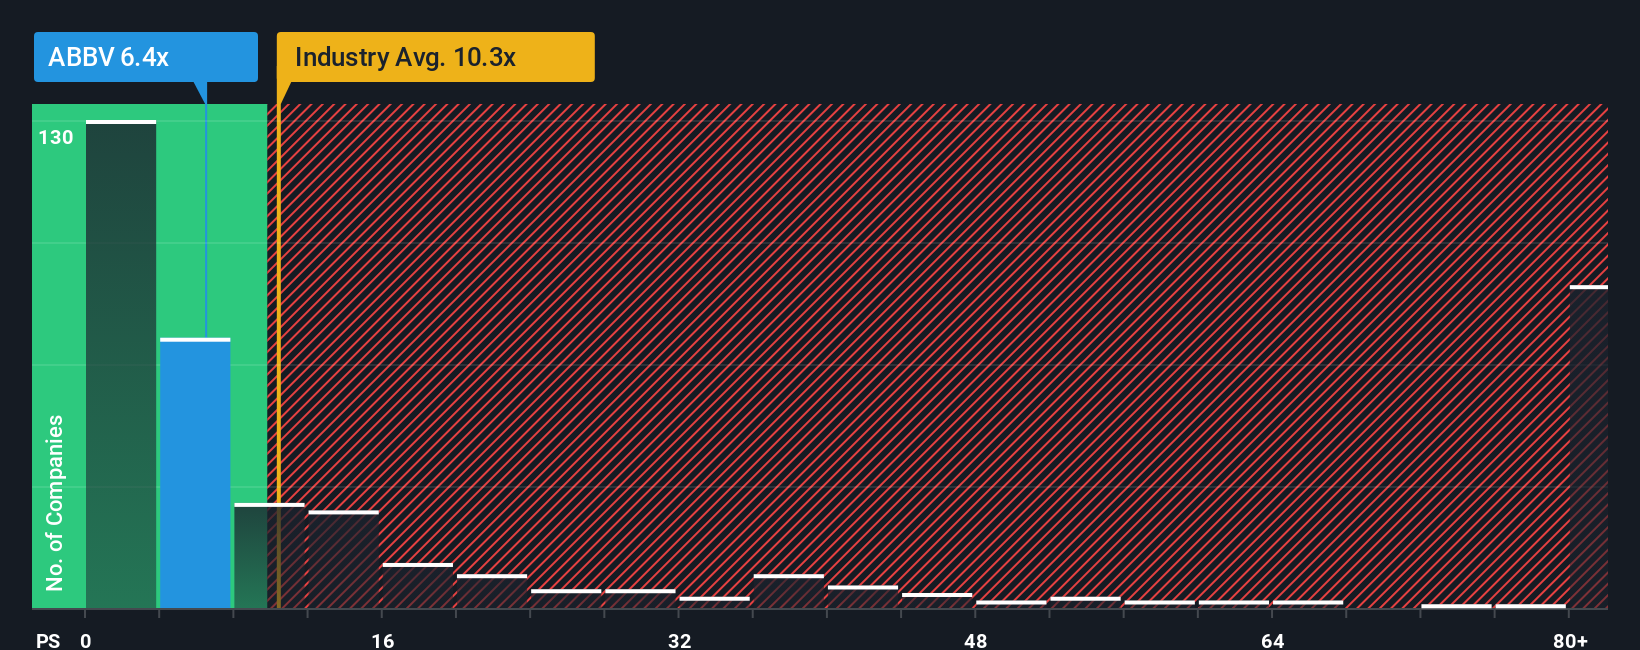
For established, profitable healthcare companies like AbbVie, the price-to-sales multiple is a useful way to gauge how much investors are paying for each dollar of revenue, especially when earnings can be distorted by one-off items or investment cycles. In general, higher expected growth and lower perceived risk justify a richer multiple, while slower growth or greater uncertainty usually warrant a discount.
AbbVie currently trades on a price-to-sales ratio of 6.8x, slightly above the Biotechs industry average of about 12.4x but close to the 6.5x peer average for similar companies. To go a step further, Simply Wall St calculates a Fair Ratio of 11.3x, which is the price-to-sales multiple AbbVie might reasonably command given its growth outlook, profitability, industry position, market cap and risk profile. This Fair Ratio is more tailored than a simple comparison with peers or sector averages because it blends company-specific fundamentals with broader market context.
Since AbbVie’s actual 6.8x multiple sits well below the 11.3x Fair Ratio, the stock screens as attractively valued on a sales-based lens.
Result: UNDERVALUED
PS ratios tell one story, but what if the real opportunity lies elsewhere? Discover 1460 companies where insiders are betting big on explosive growth.
Upgrade Your Decision Making: Choose your AbbVie Narrative
Earlier we mentioned that there is an even better way to understand valuation, so let us introduce you to Narratives, which are simply your story about AbbVie, expressed through your assumptions for its future revenues, earnings, margins and fair value. All of these elements are linked together in a clear forecast that you can track over time.
A Narrative connects what you believe about AbbVie’s business, for example the strength of Skyrizi and Rinvoq after Humira, to a set of numbers in a financial model and finally to a single Fair Value estimate. You can then compare this estimate to the current share price to decide whether you see AbbVie as a buy, hold or sell.
On Simply Wall St, Narratives live in the Community page and are used by millions of investors as an easy, accessible tool. They update dynamically whenever new information like earnings results or major news arrives, so your fair value and investment stance can evolve with the story instead of staying frozen at one point in time.
For instance, one AbbVie Narrative might lean bullish with a Fair Value near the high end of recent targets around 255 dollars, assuming strong post Humira growth and resilient margins. A more cautious Narrative could anchor closer to 170 dollars, reflecting concerns about pricing, pipeline risk and concentration in a few key drugs. By comparing each Narrative’s Fair Value to today’s price, you can see which story best matches your own expectations and risk tolerance in a single, practical decision framework.
Do you think there's more to the story for AbbVie? Head over to our Community to see what others are saying!
This article by Simply Wall St is general in nature. We provide commentary based on historical data and analyst forecasts only using an unbiased methodology and our articles are not intended to be financial advice. It does not constitute a recommendation to buy or sell any stock, and does not take account of your objectives, or your financial situation. We aim to bring you long-term focused analysis driven by fundamental data. Note that our analysis may not factor in the latest price-sensitive company announcements or qualitative material. Simply Wall St has no position in any stocks mentioned.
Have feedback on this article? Concerned about the content? Get in touch with us directly. Alternatively, email editorial-team@simplywallst.com