
Assessing ASA Gold and Precious Metals (NYSE:ASA) Valuation After Strong Earnings Highlight and Market Rally Interest
ASA Gold and Precious Metals (ASA) has just been spotlighted as a rare opportunity in the metals and mining space, after its strong earnings and revenue growth stood out during the latest US market rally.
See our latest analysis for ASA Gold and Precious Metals.
That attention has come on the back of powerful price action, with a roughly 27 percent 30 day share price return and a 192 percent year to date share price return. The 1 year total shareholder return above 200 percent signals that momentum has been building rather than fading.
If ASA’s run has you rethinking where the next big move might come from, it could be worth exploring fast growing stocks with high insider ownership as a fresh hunting ground for ideas.
But with ASA now trading close to estimated intrinsic value after such a powerful run, investors face a key question: is there still a genuine buying opportunity here, or has the market already priced in future growth?
Price-to-Earnings of 3.1x: Is it justified?
On a price-to-earnings basis, ASA Gold and Precious Metals looks inexpensive at 3.1x earnings compared to a last close of $61.36 and far richer peer valuations.
The price to earnings ratio compares what investors pay today for each dollar of current earnings. This is a key yardstick for capital markets firms where profits can be volatile but meaningful. For ASA, such a low multiple suggests the market is either discounting the sustainability of its recent profit surge or has not fully repriced the business after its strong results.
Against both the broader US market and its direct Capital Markets peers, ASA trades at a deep discount. Its 3.1x price to earnings multiple sits well below the US market average of 19.1x and the industry average of 25.6x, as well as a peer average of 23.9x. This underscores how dramatic the valuation gap has become.
See what the numbers say about this price — find out in our valuation breakdown.
Result: Price-to-Earnings of 3.1x (UNDERVALUED)
However, investors should still weigh risks such as a reversal in precious metal prices and volatility in mining equities that could quickly compress ASA’s valuation.
Find out about the key risks to this ASA Gold and Precious Metals narrative.
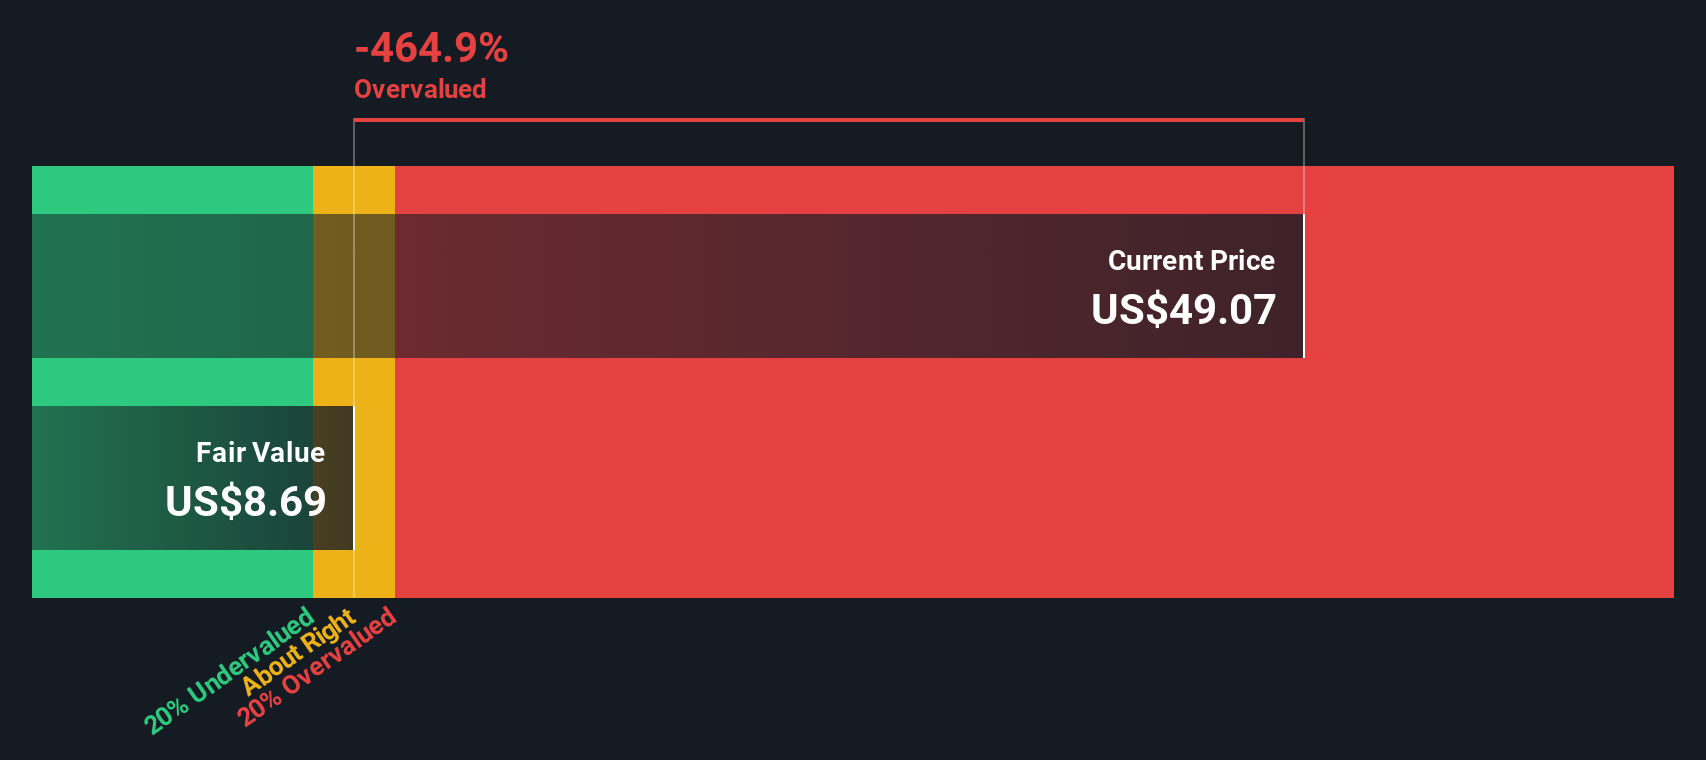
Another View: Our DCF Model Paints a Harsher Picture
While the low price to earnings ratio makes ASA Gold and Precious Metals look cheap, our DCF model suggests the shares may actually be trading well above fair value, at $61.36 versus an estimated $8.45. Is recent earnings strength masking longer term risks that cash flow cannot justify?
Look into how the SWS DCF model arrives at its fair value.
Simply Wall St performs a discounted cash flow (DCF) on every stock in the world every day (check out ASA Gold and Precious Metals for example). We show the entire calculation in full. You can track the result in your watchlist or portfolio and be alerted when this changes, or use our stock screener to discover 904 undervalued stocks based on their cash flows. If you save a screener we even alert you when new companies match - so you never miss a potential opportunity.
Build Your Own ASA Gold and Precious Metals Narrative
If you want to stress test these assumptions or dig into the numbers yourself, you can quickly build a personalised view in under three minutes: Do it your way.
A great starting point for your ASA Gold and Precious Metals research is our analysis highlighting 2 key rewards and 2 important warning signs that could impact your investment decision.
Looking for more investment ideas?
If you stop at ASA, you could miss other powerful setups, so use the Simply Wall St Screener to uncover high conviction opportunities before the crowd.
- Capture potential multi baggers early by tracking these 3629 penny stocks with strong financials that already pair strong balance sheets with real business momentum.
- Ride powerful secular trends by focusing on these 24 AI penny stocks positioned at the heart of machine learning and automation tailwinds.
- Lock in mispriced quality by zeroing in on these 904 undervalued stocks based on cash flows where robust cash flows are not yet reflected in the share price.
This article by Simply Wall St is general in nature. We provide commentary based on historical data and analyst forecasts only using an unbiased methodology and our articles are not intended to be financial advice. It does not constitute a recommendation to buy or sell any stock, and does not take account of your objectives, or your financial situation. We aim to bring you long-term focused analysis driven by fundamental data. Note that our analysis may not factor in the latest price-sensitive company announcements or qualitative material. Simply Wall St has no position in any stocks mentioned.
Have feedback on this article? Concerned about the content? Get in touch with us directly. Alternatively, email editorial-team@simplywallst.com