
Does Tradeweb Still Offer Value After Recent Gains Despite Weak Valuation Signals?
- If you are wondering whether Tradeweb Markets at around $107 a share still offers value or if most of the upside is already priced in, you are not alone.
- The stock has crept higher in the short term, up about 2.5% over the last week and 2.0% over the past month, even though it is still down roughly 18.3% year to date and 19.8% over the last year, following a strong 68.5% gain over three years and 77.7% over five years.
- Recent moves have come as investors refocus on Tradeweb's structural role in electronic bond and derivatives trading. In that space, volumes tend to rise when markets are volatile or when institutions keep shifting activity off voice and onto screens. That backdrop has kept Tradeweb in the conversation as a long term market infrastructure play, even as short term sentiment has moved with broader financials and rate expectations.
- Despite that narrative, the company currently scores just 0/6 on our valuation checks. Next we will unpack what different valuation methods say about Tradeweb today and then finish with an even more practical way to think about its true worth.
Tradeweb Markets scores just 0/6 on our valuation checks. See what other red flags we found in the full valuation breakdown.
Approach 1: Tradeweb Markets Excess Returns Analysis
The Excess Returns model looks at how much profit a company can generate above the return that investors reasonably demand on their equity, then projects how long those excess profits can be sustained.
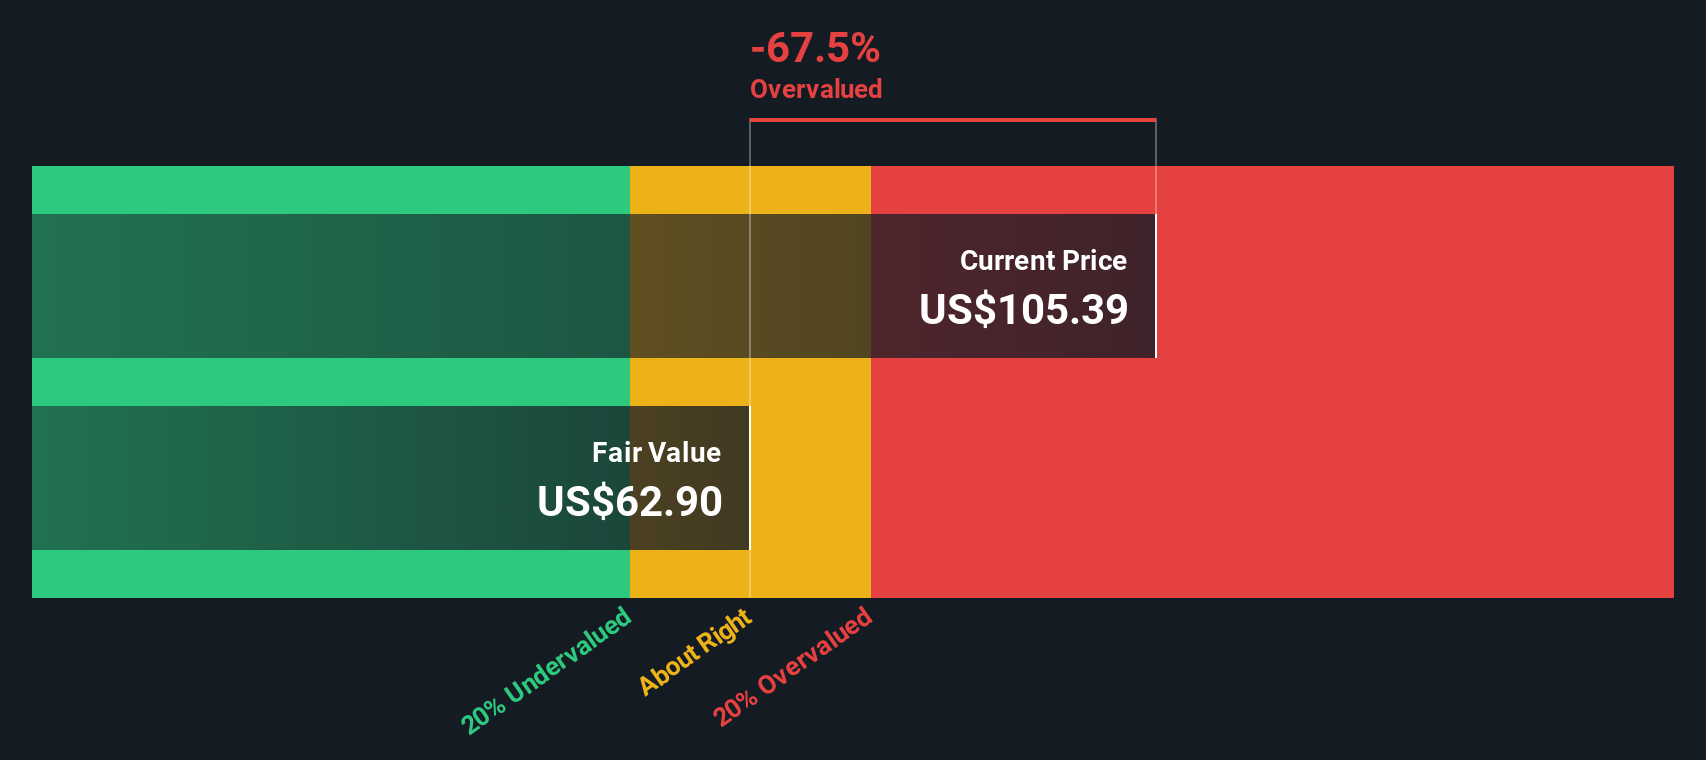
For Tradeweb, the model starts with a Book Value of $29.43 per share and a Stable EPS estimate of $4.18 per share, based on weighted future Return on Equity forecasts from 5 analysts. With an Average Return on Equity of 12.44% and a Cost of Equity of $2.71 per share, the implied Excess Return is $1.47 per share. Analysts also expect Stable Book Value to rise to about $33.57 per share, based on estimates from 3 analysts, supporting a view that Tradeweb can keep reinvesting at attractive, but not spectacular, rates.
When these excess returns are projected forward and discounted, the model produces an intrinsic value of about $64.04 per share. Versus a market price around $107, the Excess Returns approach implies the stock is roughly 67.4% overvalued.
Result: OVERVALUED
Our Excess Returns analysis suggests Tradeweb Markets may be overvalued by 67.4%. Discover 904 undervalued stocks or create your own screener to find better value opportunities.
Approach 2: Tradeweb Markets Price vs Earnings
For profitable companies like Tradeweb, the price to earnings ratio is a useful yardstick because it links what investors pay today to the profits the business is already generating. A higher PE can be justified when earnings are expected to grow quickly and the business model is relatively low risk, while slower growth or higher uncertainty usually call for a lower, more conservative multiple.
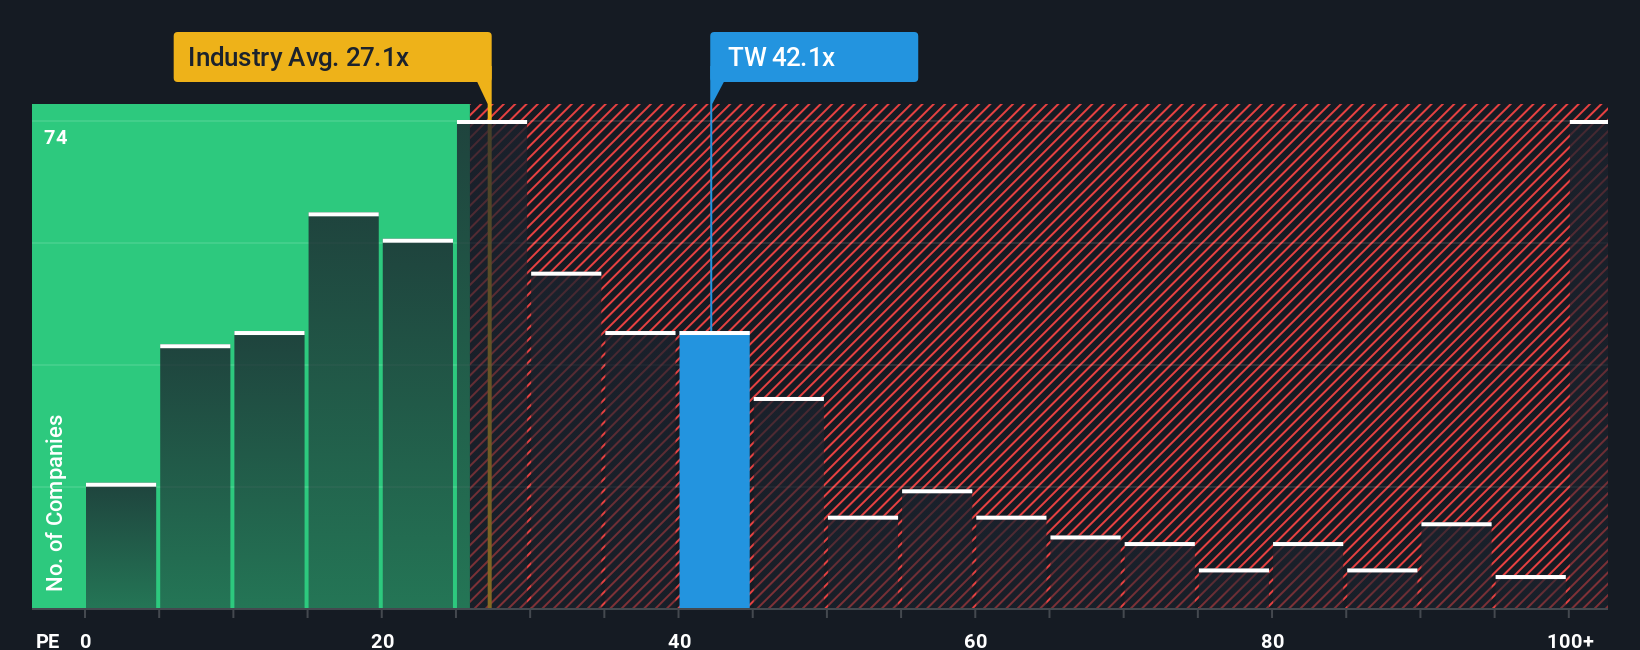
Tradeweb currently trades on a PE of about 36.4x, which is well above both the Capital Markets industry average of roughly 25.6x and its peer group average of around 29.0x. To get beyond these broad comparisons, Simply Wall St also calculates a Fair Ratio, the PE level that would be reasonable given Tradeweb’s specific growth outlook, profitability, size and risk profile. That Fair Ratio sits closer to 16.5x, implying a much lower valuation would be appropriate once these fundamentals are accounted for.
Because the Fair Ratio directly incorporates company specific drivers rather than relying only on rough industry or peer averages, it offers a more tailored perspective. Against that benchmark, Tradeweb’s current 36.4x PE looks stretched, suggesting the market is paying a significant premium to its fundamentals.
Result: OVERVALUED
PE ratios tell one story, but what if the real opportunity lies elsewhere? Discover 1460 companies where insiders are betting big on explosive growth.
Upgrade Your Decision Making: Choose your Tradeweb Markets Narrative
Earlier we mentioned that there is an even better way to understand valuation, so let us introduce you to Narratives, a simple framework that lets you describe your view of a company in words and numbers by tying your story about its future to assumptions for revenue, earnings, margins and a fair value estimate.
A Narrative links what you believe about a business, for example Tradeweb continuing to benefit from rising electronic volumes or facing tougher competition and fee pressure, to a structured forecast and then to a fair value that you can compare to today’s price so you can see whether your story points to buying, holding or selling.
On Simply Wall St, millions of investors use Narratives on the Community page as an easy tool where they can plug in their expectations, see the resulting fair value next to the live share price, and watch that view update dynamically as new news, earnings releases or guidance changes come in.
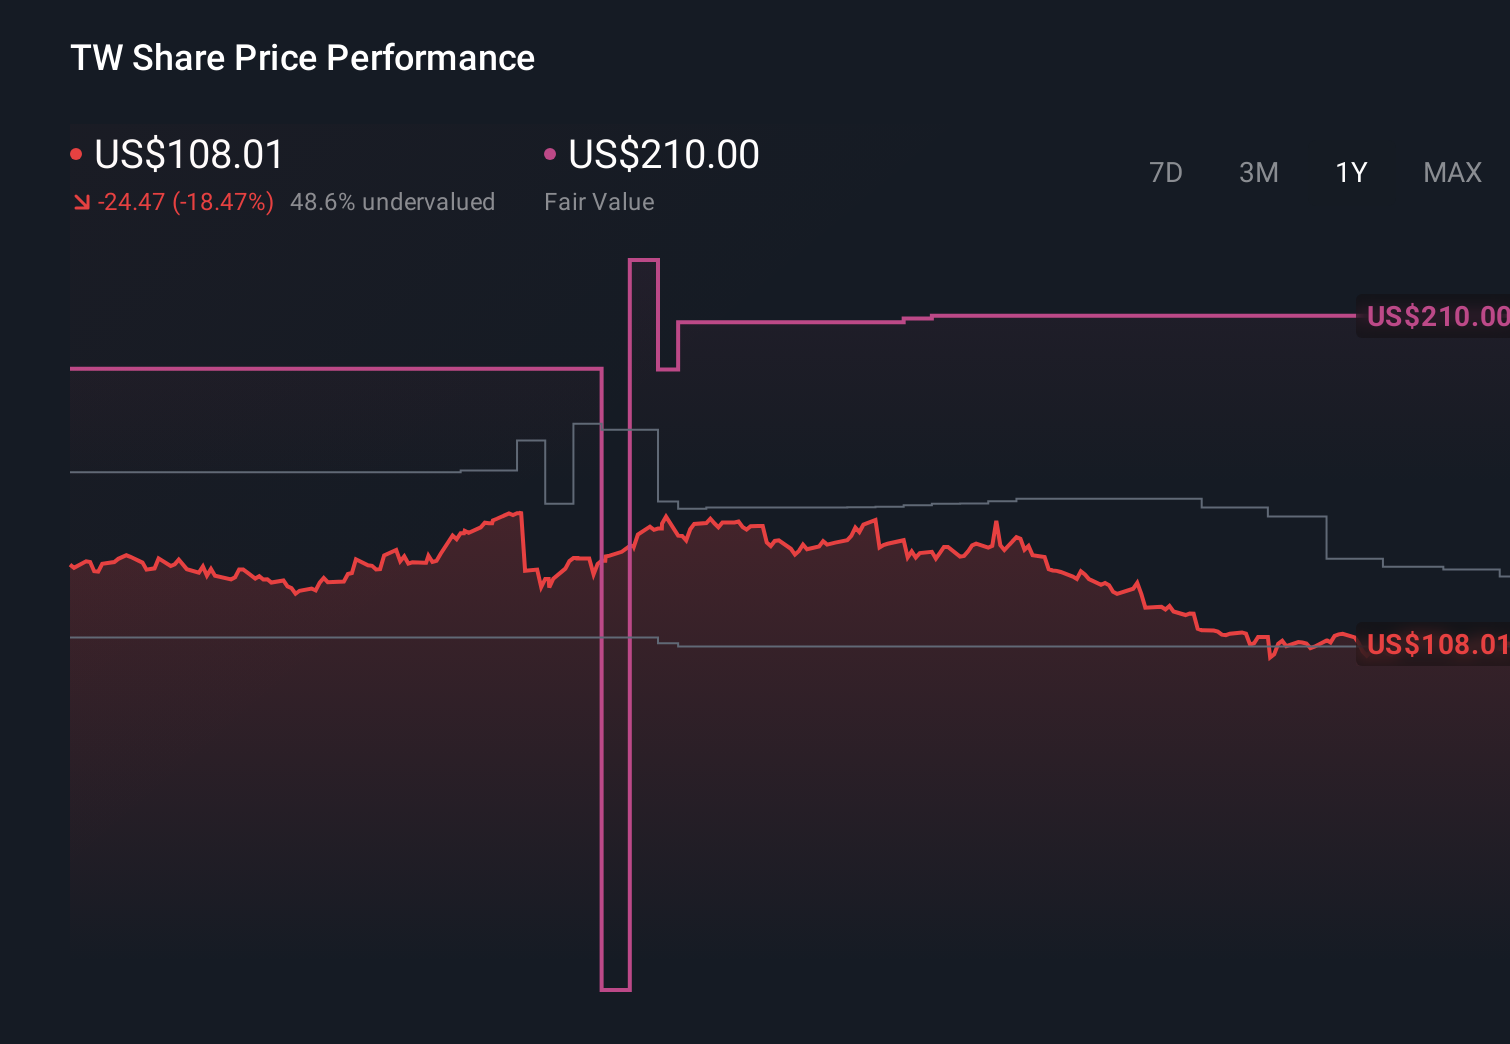
For instance, one Tradeweb investor might build a more optimistic Narrative that supports a fair value closer to $210, while a more cautious investor might see the same information and conclude a fair value near $118. Narratives helps each of them see clearly how those different assumptions translate into different indicative prices and decisions.
Do you think there's more to the story for Tradeweb Markets? Head over to our Community to see what others are saying!
This article by Simply Wall St is general in nature. We provide commentary based on historical data and analyst forecasts only using an unbiased methodology and our articles are not intended to be financial advice. It does not constitute a recommendation to buy or sell any stock, and does not take account of your objectives, or your financial situation. We aim to bring you long-term focused analysis driven by fundamental data. Note that our analysis may not factor in the latest price-sensitive company announcements or qualitative material. Simply Wall St has no position in any stocks mentioned.
Have feedback on this article? Concerned about the content? Get in touch with us directly. Alternatively, email editorial-team@simplywallst.com