
Does Crocs’ 2025 Valuation Reflect Its Cash Flows After Recent Share Price Rebound?
- Wondering if Crocs at around $90 a share is still a quirky fashion fad or a genuine value opportunity? Let us break down what the market might be missing.
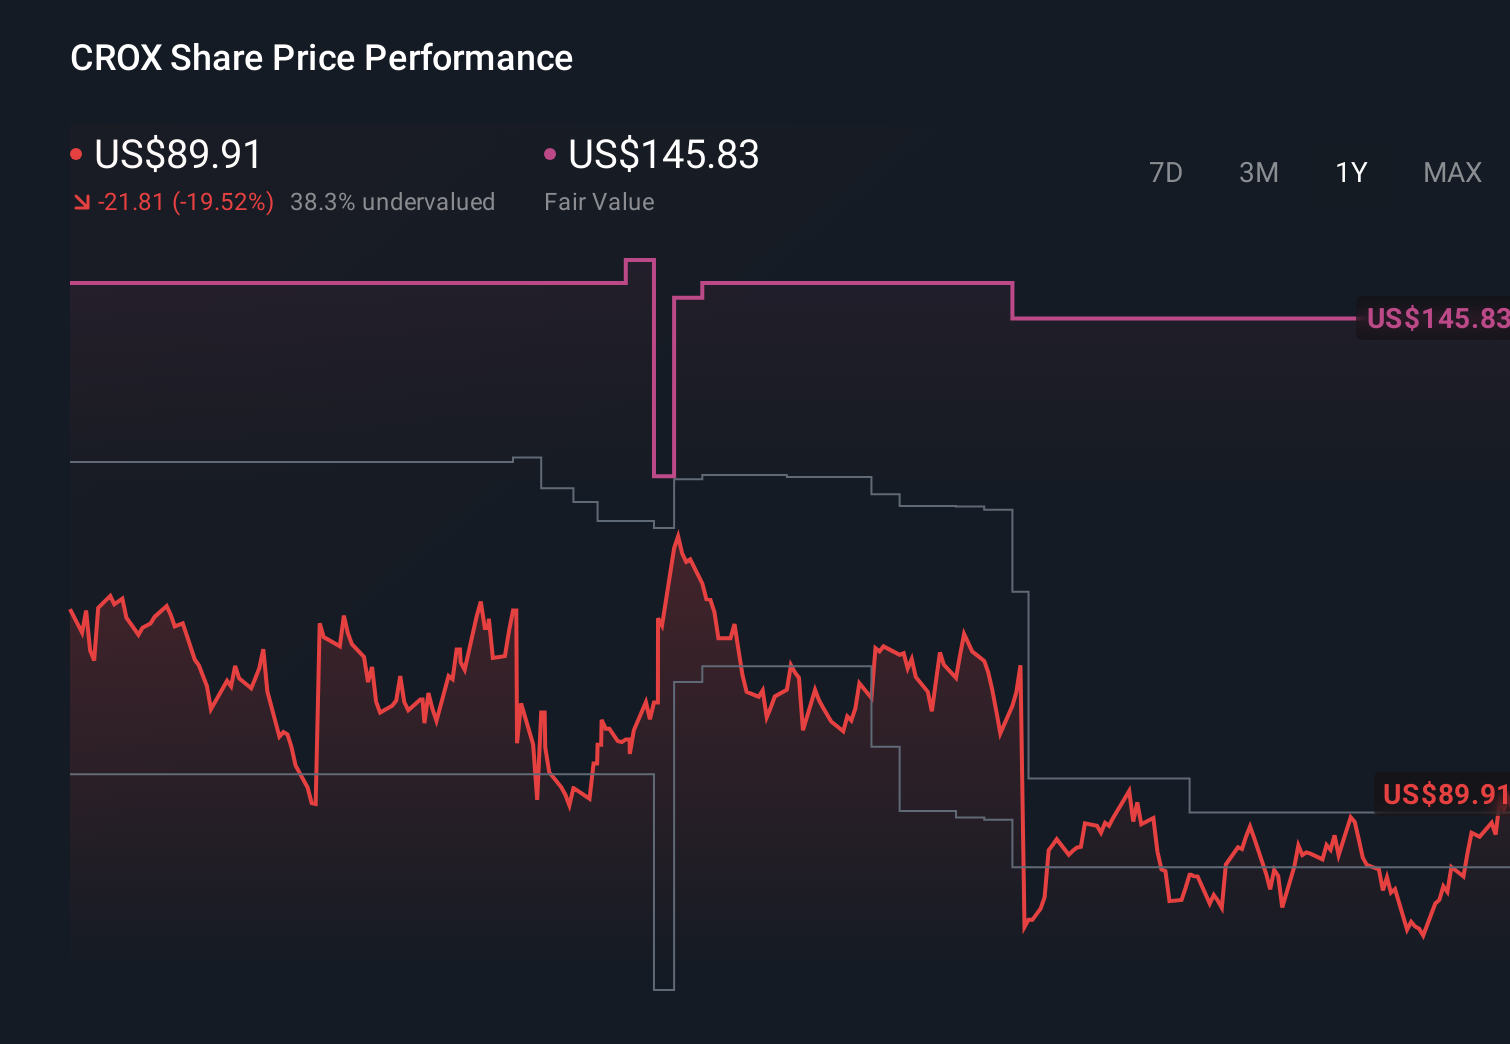
- The stock has bounced 1.3% over the last week and 9.1% over the past month, yet it is still down 17.6% year to date and 19.8% over the last year. This mix hints at shifting sentiment and potential mispricing.
- Recent headlines have focused on Crocs expanding its classic clogs and HeyDude brand presence, alongside new collaborations that keep the brand culturally relevant. At the same time, ongoing debates about whether demand can stay resilient have kept some investors cautious, adding extra drama to those price swings.
- On our checks, Crocs scores a 3/6 valuation score, suggesting it looks undervalued on several fronts but not across the board. Next, we will walk through the main valuation approaches investors are using today and then explore an even better way to think about what the stock is really worth.
Find out why Crocs's -19.8% return over the last year is lagging behind its peers.
Approach 1: Crocs Discounted Cash Flow (DCF) Analysis
A Discounted Cash Flow model estimates what a business is worth by projecting the cash it can generate in the future and then discounting those cash flows back to today in dollar terms.
For Crocs, the latest twelve month Free Cash Flow is about $697 million, a strong base that underpins the valuation. Analysts provide detailed forecasts for the next few years. These are then extended by Simply Wall St into longer term projections. By 2027, annual Free Cash Flow is expected to be roughly $626 million, with the following years slipping only modestly before gradually climbing again toward the mid to high $600 million range by 2035.
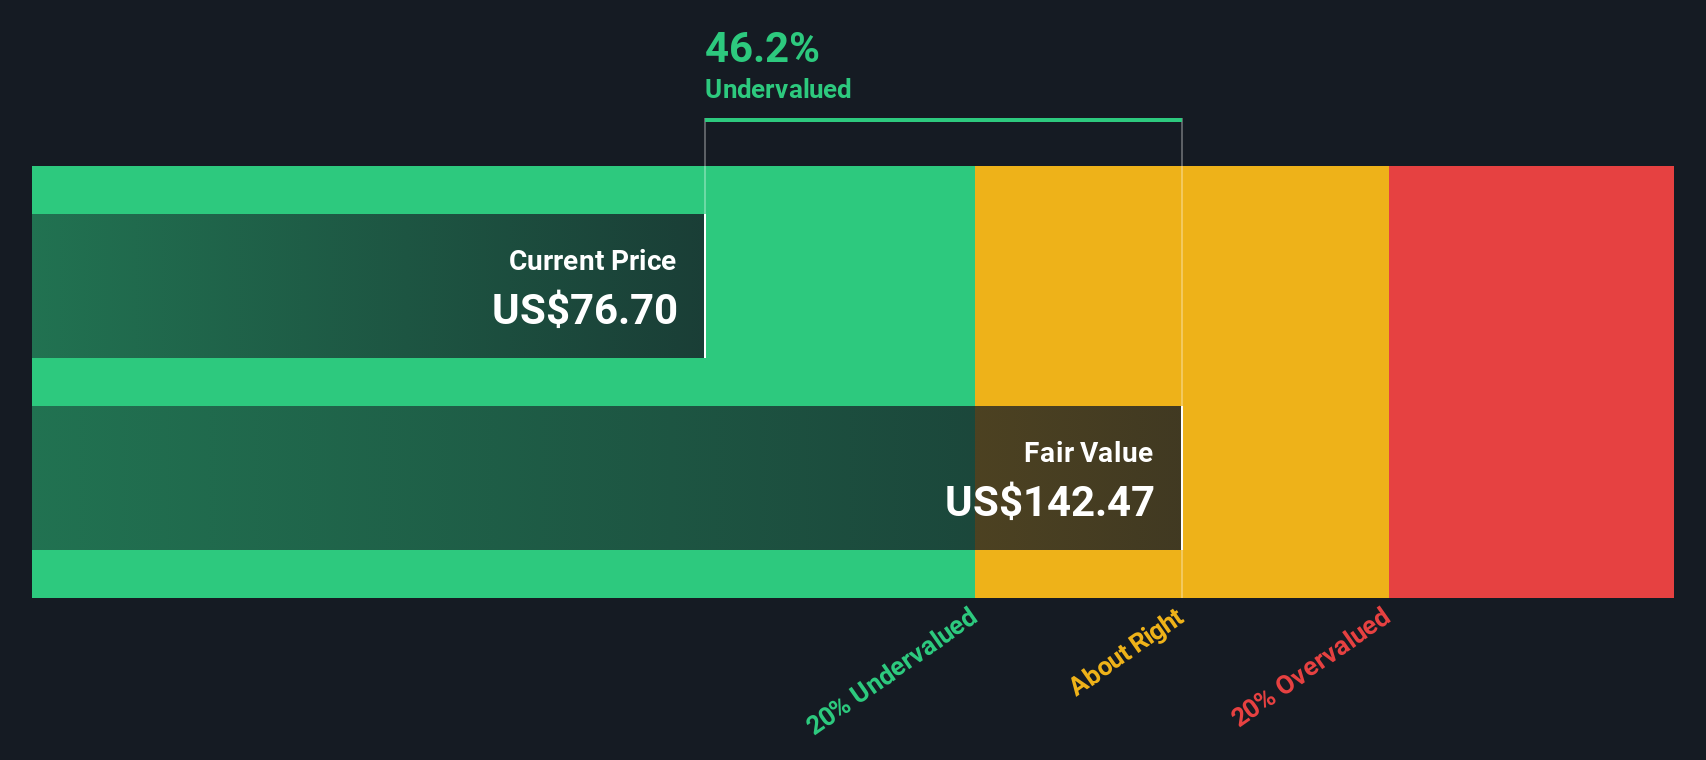
Using a 2 Stage Free Cash Flow to Equity model, these cash flows are discounted back to arrive at an estimated intrinsic value of about $159.40 per share. Compared with a share price around $90, the DCF implies the stock is roughly 43.2% undervalued, which indicates that the market is pricing Crocs well below its modeled cash generation power.
Result: UNDERVALUED
Our Discounted Cash Flow (DCF) analysis suggests Crocs is undervalued by 43.2%. Track this in your watchlist or portfolio, or discover 904 more undervalued stocks based on cash flows.
Approach 2: Crocs Price vs Earnings
For profitable companies like Crocs, the Price to Earnings ratio is a practical way to gauge value because it directly links what investors pay today with the profits the business is already generating. In general, faster growing and lower risk companies deserve higher PE ratios, while slower growth or higher uncertainty tend to pull that multiple down.
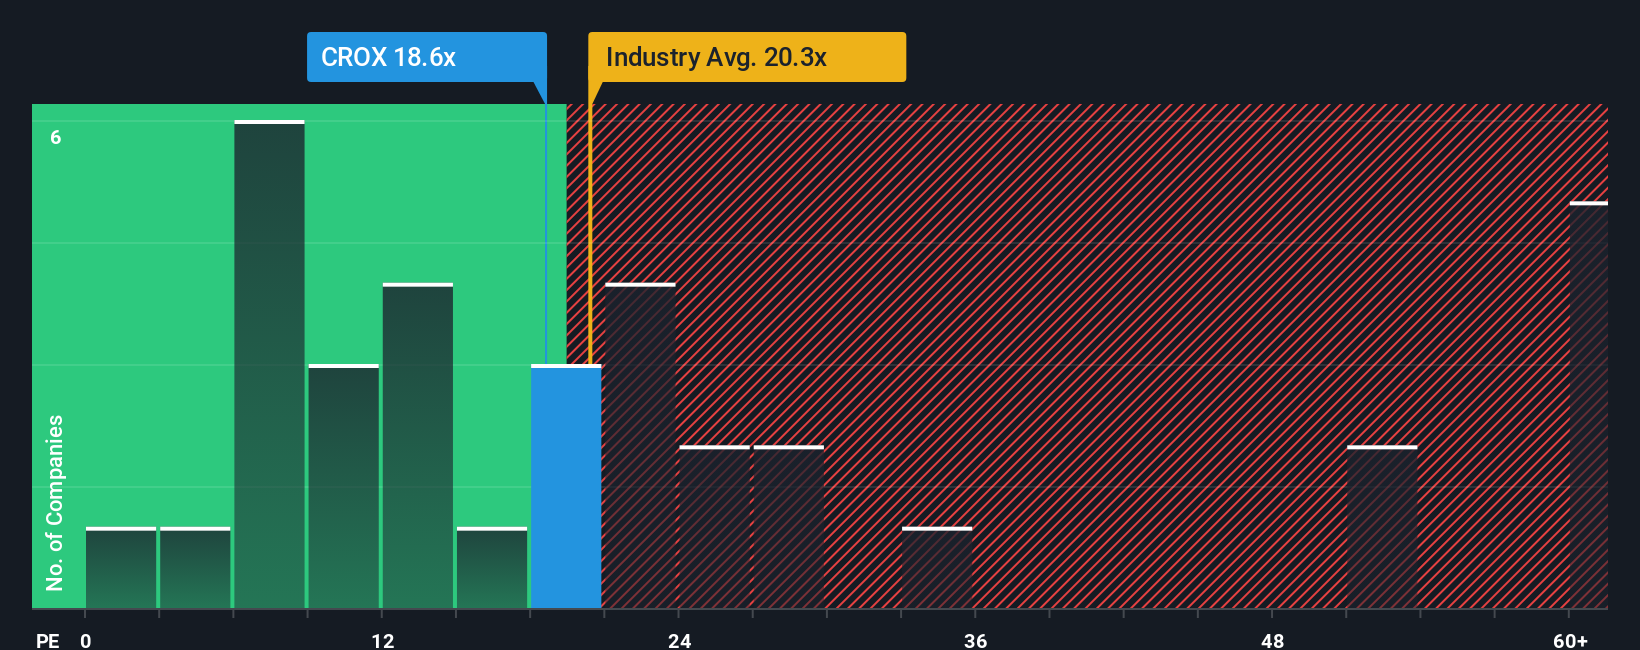
Crocs currently trades on about 25.8x earnings, which is above the broader Luxury industry average of roughly 19.9x and slightly above its peer group at about 23.7x. At first glance, that premium might suggest the stock is getting expensive. However, Simply Wall St calculates a Fair Ratio of around 59.7x for Crocs, a proprietary estimate of what its PE could reasonably be given its earnings growth outlook, profitability, industry, size and risk profile.
This Fair Ratio is more tailored than a simple peer or industry comparison because it adjusts for the specific strengths and risks of Crocs rather than assuming it should look like an average Luxury stock. With the current PE well below the Fair Ratio, the multiple based view lines up with the DCF and points to a market that is still underpricing the company.
Result: UNDERVALUED
PE ratios tell one story, but what if the real opportunity lies elsewhere? Discover 1460 companies where insiders are betting big on explosive growth.
Upgrade Your Decision Making: Choose your Crocs Narrative
Earlier we mentioned that there is an even better way to understand valuation, so let us introduce you to Narratives, a simple framework on Simply Wall St’s Community page. Here you connect your view of a company’s story with explicit assumptions for future revenue, earnings, margins and a resulting fair value. You can then compare that fair value to today’s share price to inform your decision on whether the stock may be overvalued or undervalued. The platform continually updates your Narrative as new news or earnings arrive. You can see, for example, how one Crocs investor might assume modest 3 percent annual revenue growth, a 20 percent net margin and a 10x future PE to arrive at a fair value near $151 per share. Another investor might assume shrinking revenue, higher long term margins and a much lower future PE to reach a fair value closer to $90. This makes it easier to understand why intelligent investors can disagree and which story you personally find more convincing.
For Crocs, however, here are previews of two leading Crocs narratives:
Fair value: $151.43 per share
Implied undervaluation vs last close: approximately 40.1%
Revenue growth assumption: 3%
- Assumes steady 3% annual revenue growth driven by international expansion in Asia and Europe and a stronger direct to consumer mix.
- Assumes Crocs can sustain a 20% net profit margin based on high gross margins and an efficient, increasingly DTC focused model.
- Applies a 10x future P/E and a 10% discount rate to arrive at a fair value of $151.43 per share.
Fair value: $89.75 per share
Implied overvaluation vs last close: approximately 1.0%
Revenue growth assumption: -0.64%
- Highlights pressures from softer U.S. demand, fashion cyclicality, HEYDUDE weakness, and rising tariff and sustainability risks.
- Builds in slightly contracting revenue but higher long term margins and a low future P/E multiple to reflect demand and brand risk.
- Arrives at a fair value close to $89.75 per share, indicating the stock is trading near that level.
Do you think there's more to the story for Crocs? Head over to our Community to see what others are saying!
This article by Simply Wall St is general in nature. We provide commentary based on historical data and analyst forecasts only using an unbiased methodology and our articles are not intended to be financial advice. It does not constitute a recommendation to buy or sell any stock, and does not take account of your objectives, or your financial situation. We aim to bring you long-term focused analysis driven by fundamental data. Note that our analysis may not factor in the latest price-sensitive company announcements or qualitative material. Simply Wall St has no position in any stocks mentioned.
Have feedback on this article? Concerned about the content? Get in touch with us directly. Alternatively, email editorial-team@simplywallst.com