
Erie Indemnity (ERIE): A Fresh Look at Valuation After a 7.1% Dividend Increase
Erie Indemnity (ERIE) just approved a 7.1% increase to its regular quarterly dividend, a move that typically indicates management has confidence in the company’s cash generation and longer term earnings power.
See our latest analysis for Erie Indemnity.
Even with the higher dividend, the share price has had a rough stretch, with a year to date share price return of around negative 31 percent while the three year total shareholder return of roughly 19 percent still shows longer term wealth creation. This suggests current weakness may reflect a reset in expectations rather than a broken business.
If this dividend move has you rethinking your income and quality mix, it could be worth exploring pharma stocks with solid dividends as another hunting ground for dependable payouts.
With earnings still growing and a richer dividend in place despite a sharp share price pullback, investors now face a key question: Is Erie Indemnity quietly undervalued, or is the market already discounting future growth?
Price-to-Earnings of 22.9x: Is it justified?
Erie Indemnity last closed at 284 dollars, and the stock trades on a 22.9 times price to earnings ratio, a clear premium to both peers and its own estimated fair level.
The price to earnings multiple compares the current share price to the company’s earnings per share. It is a quick way to gauge how much investors are willing to pay for each dollar of profit in a mature, profitable insurer like ERIE.
Here, investors are paying significantly more than the US Insurance industry average of 13.4 times earnings, and also well above the peer group average of 13.6 times. This suggests the market is pricing in stronger or more durable earnings than a typical insurer. However, our analysis indicates that a fair price to earnings level for ERIE could be closer to 15.1 times, a level the valuation could drift toward if sentiment on its growth or quality normalises.
Explore the SWS fair ratio for Erie Indemnity
Result: Price-to-Earnings of 22.9x (OVERVALUED)
However, investors should still consider risks such as slower policy growth or regulatory shifts that compress margins, which could quickly undermine the current valuation premium.
Find out about the key risks to this Erie Indemnity narrative.
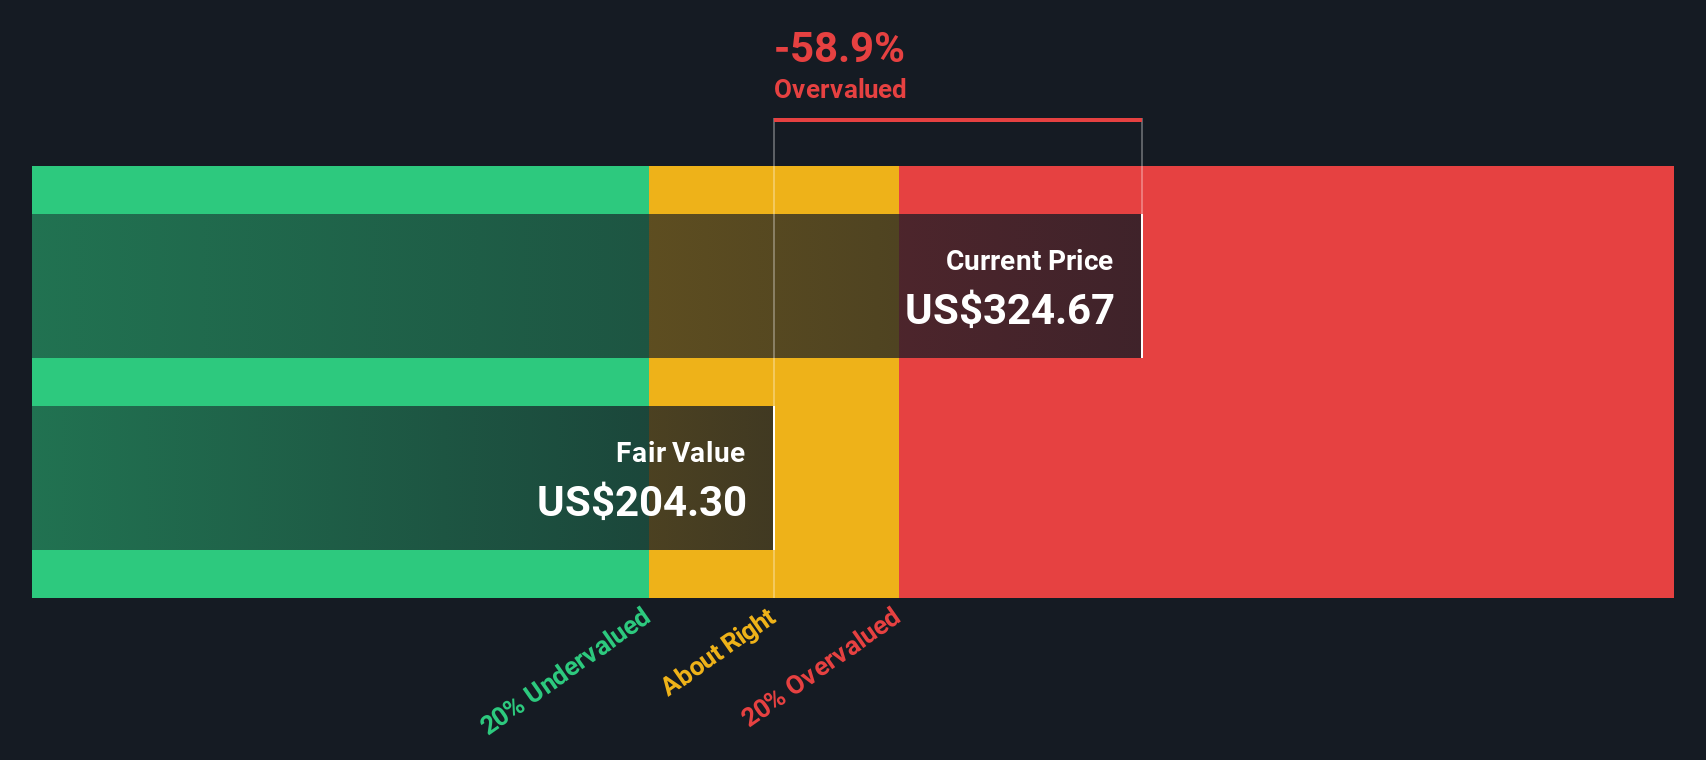
Another View: DCF Suggests a Smaller Gap
Our DCF model presents a slightly different picture, with Erie Indemnity’s estimated fair value at 221.51 dollars, around 22 percent below the current 284 dollar share price. That still indicates potential overvaluation, but by a narrower margin than the earnings multiple. Investors will need to decide which risk measure they consider more reliable.
Look into how the SWS DCF model arrives at its fair value.
Simply Wall St performs a discounted cash flow (DCF) on every stock in the world every day (check out Erie Indemnity for example). We show the entire calculation in full. You can track the result in your watchlist or portfolio and be alerted when this changes, or use our stock screener to discover 904 undervalued stocks based on their cash flows. If you save a screener we even alert you when new companies match - so you never miss a potential opportunity.
Build Your Own Erie Indemnity Narrative
If you see things differently or prefer to dig into the numbers yourself, you can build a personalised view in just minutes: Do it your way.
A good starting point is our analysis highlighting 3 key rewards investors are optimistic about regarding Erie Indemnity.
Ready for your next investment move?
If Erie Indemnity has sharpened your thinking, do not stop here. Use the Simply Wall Street Screener to uncover your next edge before others spot it.
- Capture high potential trends early by scanning these 24 AI penny stocks positioned at the intersection of breakthrough technology and accelerating earnings growth.
- Strengthen your income stream by targeting these 10 dividend stocks with yields > 3% that balance attractive yields with solid underlying fundamentals.
- Position yourself for mispriced upside by focusing on these 904 undervalued stocks based on cash flows where cash flow strength is not yet fully reflected in the share price.
This article by Simply Wall St is general in nature. We provide commentary based on historical data and analyst forecasts only using an unbiased methodology and our articles are not intended to be financial advice. It does not constitute a recommendation to buy or sell any stock, and does not take account of your objectives, or your financial situation. We aim to bring you long-term focused analysis driven by fundamental data. Note that our analysis may not factor in the latest price-sensitive company announcements or qualitative material. Simply Wall St has no position in any stocks mentioned.
Have feedback on this article? Concerned about the content? Get in touch with us directly. Alternatively, email editorial-team@simplywallst.com