
Is Goldman Sachs Still Attractively Priced After Its 2025 Rally and Strategic Refocus?
- Wondering if Goldman Sachs Group at around $910 a share is still a smart buy, or if the best gains are already in the rear view mirror? This breakdown will help you decide whether the current price still stacks up against its fundamentals.
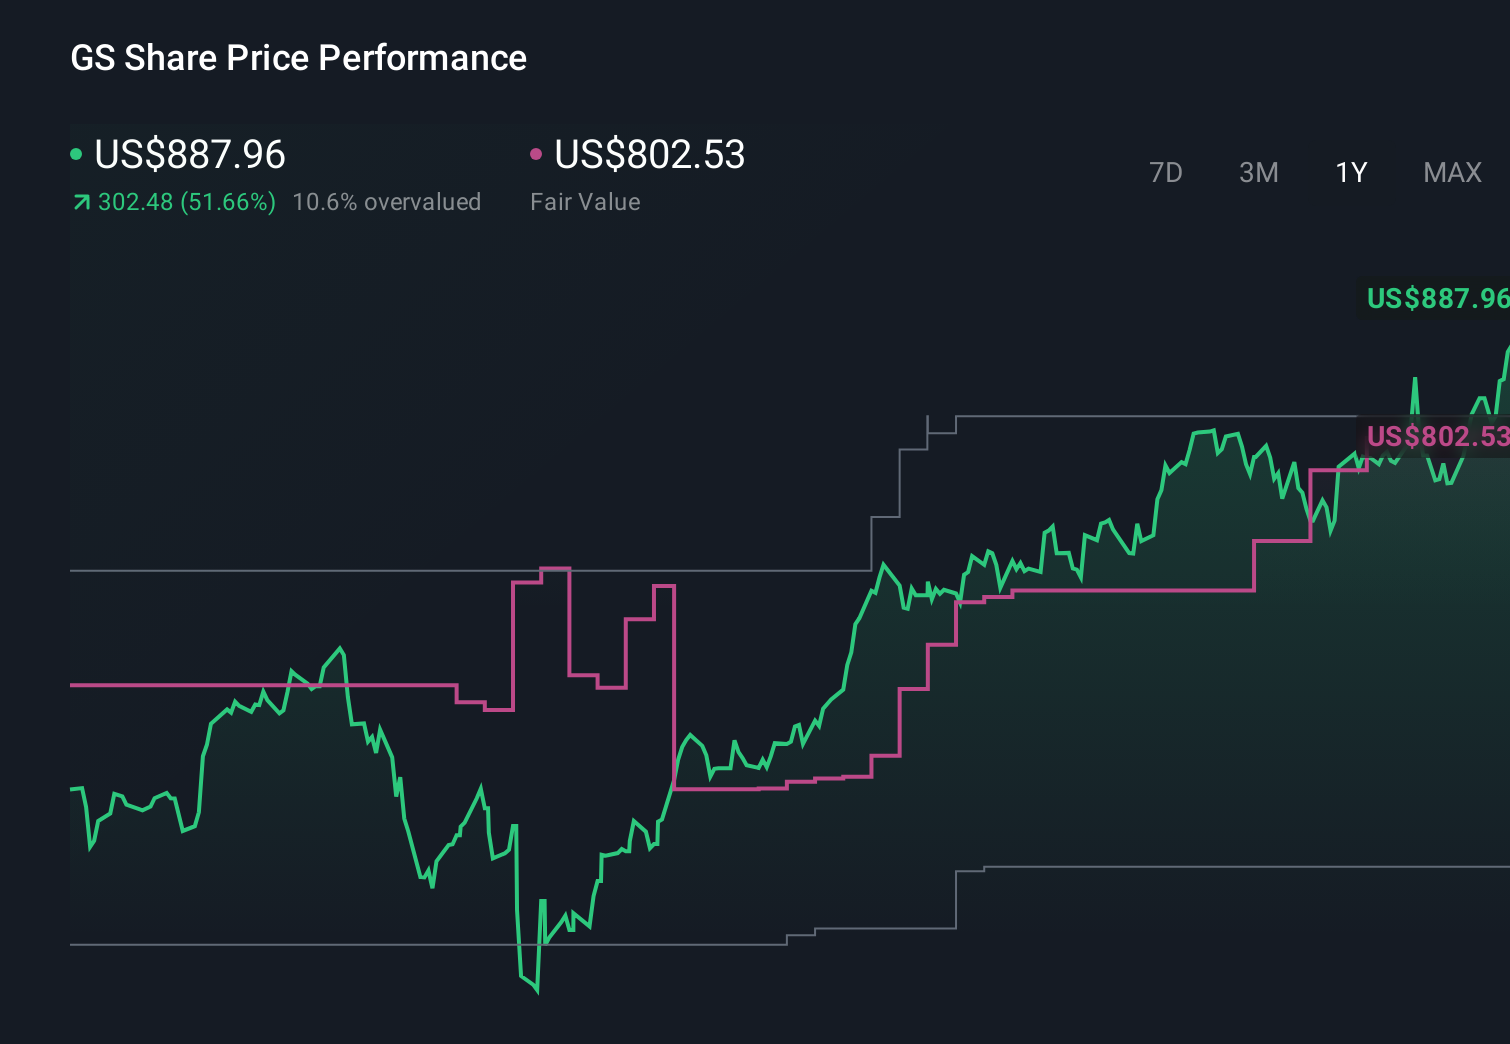
- The stock has climbed 4.4% over the last week, 15.2% over the past month and 58.4% year to date, adding to a 59.5% 1 year return and a 295.3% gain over five years that naturally raises questions about how much value is left.
- Recently, markets have been reacting to Goldman Sachs refocusing on its core institutional and investment banking engines, along with strategic moves in wealth and asset management that aim for steadier, fee based revenue. At the same time, ongoing dealmaking and capital markets activity have reinforced the narrative that Goldman is leaning into its traditional strengths while trimming less profitable ventures.
- On our checklist of six valuation tests, Goldman Sachs scores a 3 out of 6. This suggests the stock looks undervalued on some metrics but fully priced on others. We will walk through those valuation methods next before circling back at the end to a more holistic way of thinking about what the market might really be pricing in.
Approach 1: Goldman Sachs Group Excess Returns Analysis
The Excess Returns model looks at how much value Goldman Sachs creates above the return that shareholders demand, based on its equity cost and profitability. Instead of focusing on raw earnings, it measures whether each dollar of equity is pulling its weight.
Goldman Sachs has a Book Value of $348.02 per share and a Stable EPS of $58.80 per share, derived from weighted future Return on Equity estimates from 13 analysts. With an Average Return on Equity of 15.26% versus a Cost of Equity of $48.16 per share, the model calculates an Excess Return of $10.64 per share, suggesting the bank is expected to earn more than its required return on capital. Analysts also see Stable Book Value rising to $385.29 per share, based on forecasts from 15 analysts.
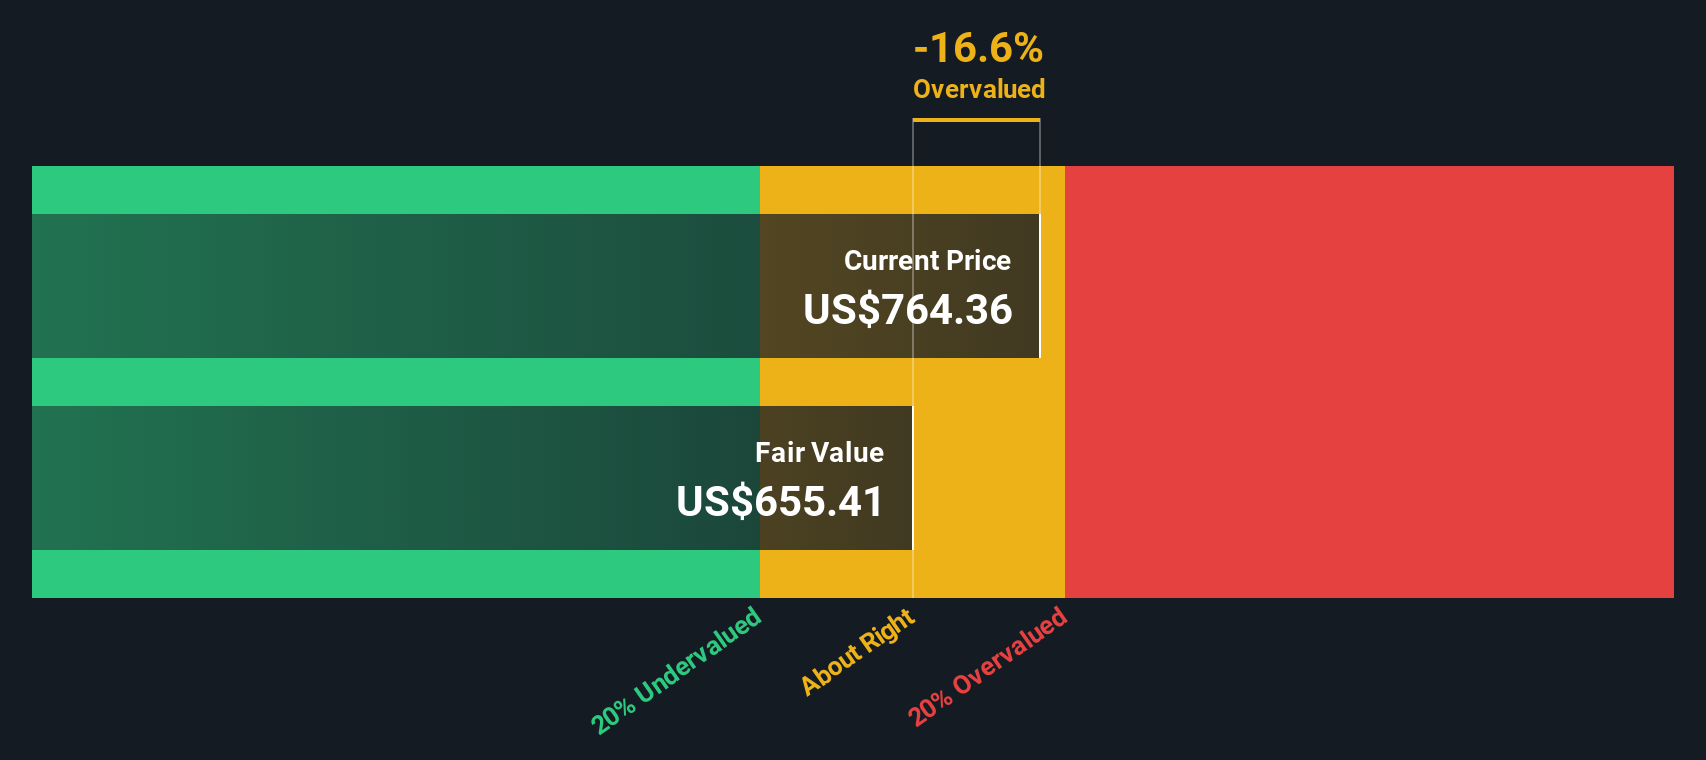
Putting these assumptions together, the Excess Returns framework estimates an intrinsic value of about $500.45 per share. Compared with the current share price around $910, the stock screens as roughly 82.0% overvalued on this method.
Result: OVERVALUED
Our Excess Returns analysis suggests Goldman Sachs Group may be overvalued by 82.0%. Discover 904 undervalued stocks or create your own screener to find better value opportunities.
Approach 2: Goldman Sachs Group Price vs Earnings
For a profitable, established institution like Goldman Sachs, the price to earnings (PE) ratio is a useful shorthand for how much investors are willing to pay for each dollar of current earnings. It naturally ties valuation to the companys ability to generate profit today, which is central for mature financial firms.
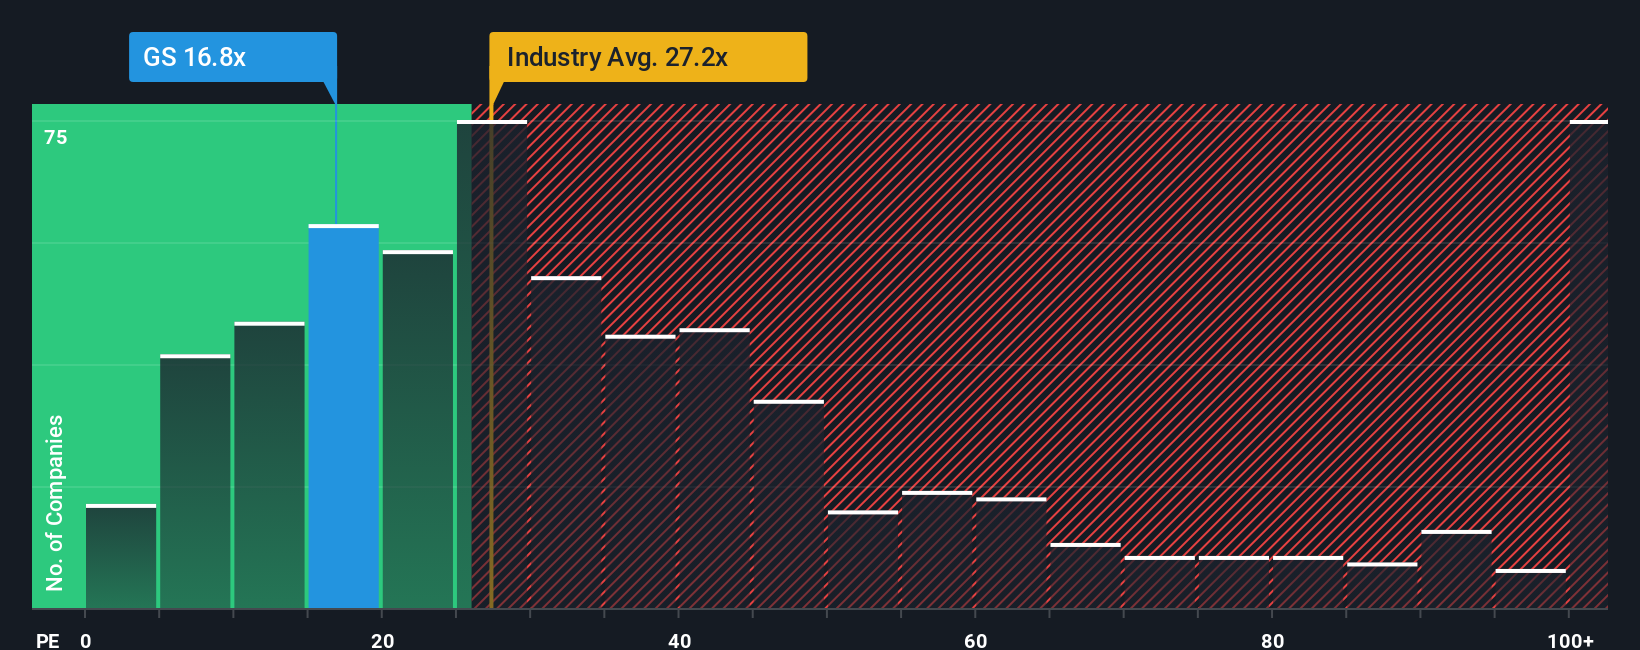
In general, faster earnings growth and lower perceived risk justify a higher, fair PE multiple, while slower growth or higher risk call for a discount. Goldman Sachs currently trades on a PE of about 18.1x, which sits below the Capital Markets industry average of roughly 25.6x and well under the peer group average of around 30.8x. On the surface, that suggests the market is applying a discount relative to many competitors.
Simply Wall Sts Fair Ratio builds on this by estimating what PE Goldman Sachs should trade on, given its specific earnings growth outlook, profitability, risk profile, industry, and market cap. That proprietary fair PE for Goldman is 19.2x, which is more tailored than a broad industry or peer comparison because it adjusts for the companys own fundamentals. With the shares at 18.1x versus a Fair Ratio of 19.2x, the stock looks modestly undervalued on this lens.
Result: UNDERVALUED
PE ratios tell one story, but what if the real opportunity lies elsewhere? Discover 1460 companies where insiders are betting big on explosive growth.
Upgrade Your Decision Making: Choose your Goldman Sachs Group Narrative
Earlier we mentioned that there is an even better way to understand valuation, so lets introduce you to Narratives, a simple framework that lets you pair your view of a companys future with a set of forecasts and a fair value, then compare that to todays share price. A Narrative is just your story behind the numbers, your assumptions about how revenue, earnings and margins will evolve, translated into a financial forecast and a fair value estimate. On Simply Wall Sts Community page, used by millions of investors, Narratives make this process accessible, guiding you from story to forecast to valuation so you can quickly see whether your fair value suggests Goldman Sachs is a buy, hold, or sell at current prices. Because Narratives update dynamically when fresh news or earnings arrive, they help you keep your thesis current rather than static. For example, one Goldman Narrative might assume deal activity, asset management growth and AI efficiencies support a fair value near $815, while a more cautious view focusing on regulatory and geopolitical risk could anchor closer to $538, and the platform lets you see exactly what would need to be true for each scenario to make sense.
Do you think there's more to the story for Goldman Sachs Group? Head over to our Community to see what others are saying!
This article by Simply Wall St is general in nature. We provide commentary based on historical data and analyst forecasts only using an unbiased methodology and our articles are not intended to be financial advice. It does not constitute a recommendation to buy or sell any stock, and does not take account of your objectives, or your financial situation. We aim to bring you long-term focused analysis driven by fundamental data. Note that our analysis may not factor in the latest price-sensitive company announcements or qualitative material. Simply Wall St has no position in any stocks mentioned.
Have feedback on this article? Concerned about the content? Get in touch with us directly. Alternatively, email editorial-team@simplywallst.com