
Fannie Mae (FNMA) valuation after senators probe counterparty risk controls and reliance on Demotech insurance ratings
A group of US senators has launched an inquiry into whether Federal National Mortgage Association (FNMA) is managing counterparty risk appropriately as it relies on Demotech insurance ratings amid rising climate related insurer failures.
See our latest analysis for Federal National Mortgage Association.
The Demotech inquiry lands against a backdrop of intense trading, with Federal National Mortgage Association’s share price at $10.8 after a powerful year to date share price return of around 214 percent and a remarkable one year total shareholder return above 300 percent. This suggests momentum is still strong even after recent volatility.
If this kind of regulatory spotlight has you rethinking where risk and upside might lie, it could be worth scanning the market for fast growing stocks with high insider ownership as potential next ideas.
Yet with Fannie Mae still loss making, trading below analyst targets but up more than 300 percent over twelve months, investors now face a key question: is there genuine value left here, or is future growth already priced in?
Price-to-Sales of 2.2x: Is it justified?
On a price-to-sales basis Federal National Mortgage Association looks inexpensive, with its 2.2x multiple sitting below both peers and the wider industry.
The price-to-sales ratio compares a company’s market value to its revenue, making it a useful gauge for a business like Fannie Mae that is currently loss making but still generates substantial top line. In this context, a lower multiple can suggest the market is not fully crediting existing revenue strength.
FNMA trades at 2.2x sales compared with a 4.1x average for direct peers and 2.5x for the broader US diversified financials space, implying investors are assigning a noticeable discount. Relative to an estimated fair price-to-sales ratio of 6.2x, that gap becomes even more apparent and shows how far sentiment could shift if expectations around profitability or growth improve.
Explore the SWS fair ratio for Federal National Mortgage Association
Result: Price-to-Sales of 2.2x (UNDERVALUED)
However, persistent losses and new regulatory scrutiny, especially around counterparty and climate related insurance risks, could quickly undermine optimism around any perceived valuation discount.
Find out about the key risks to this Federal National Mortgage Association narrative.
Another View: Our DCF Model Flashes Caution
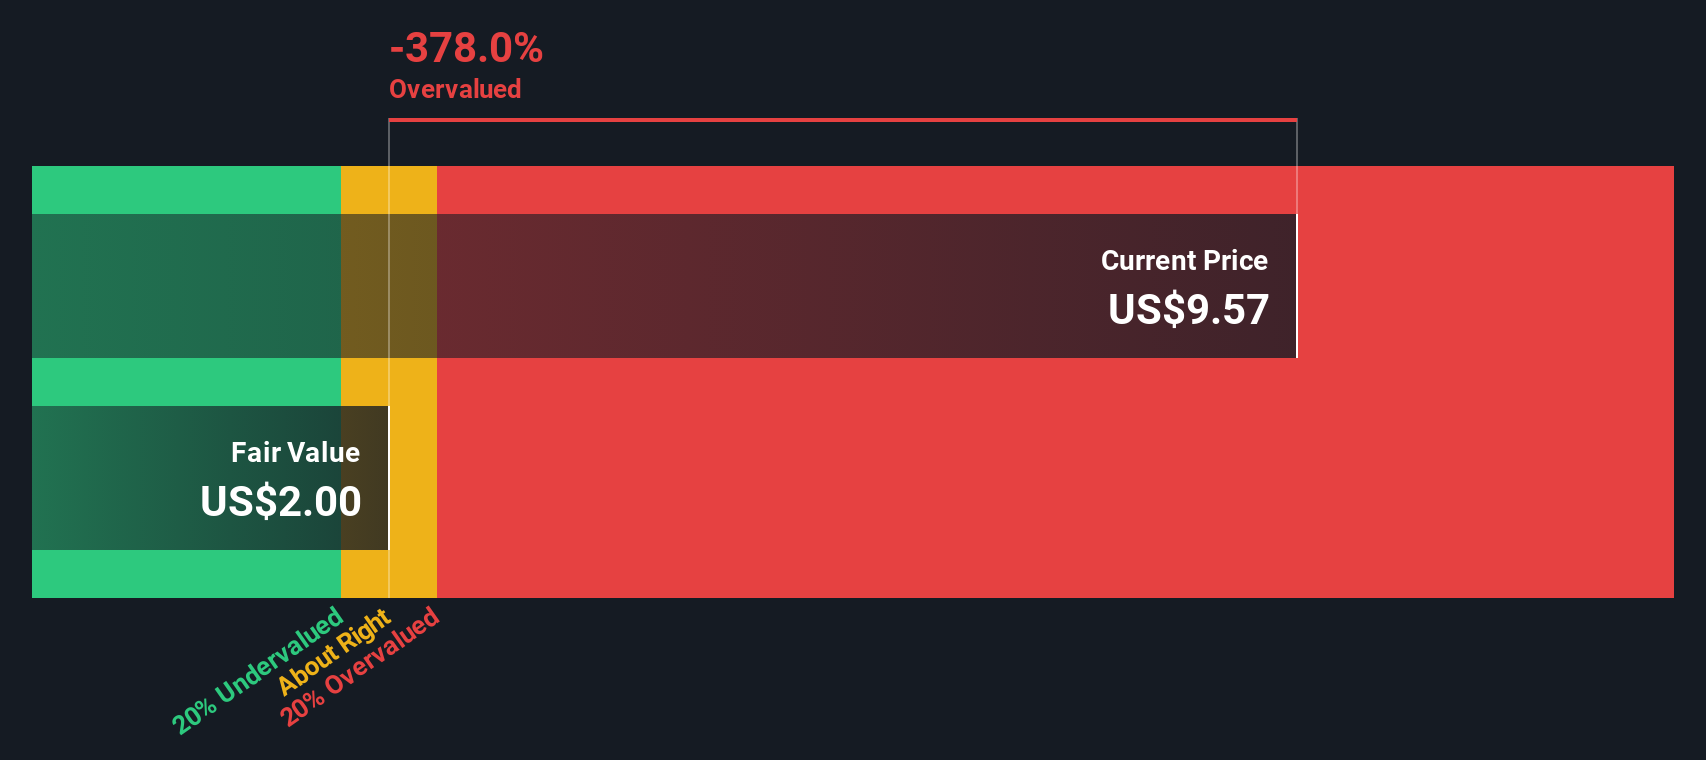
While the 2.2x price to sales ratio hints at value, our DCF model points the other way, suggesting fair value nearer $2 versus today’s $10.8. That big gap leans toward overvaluation and raises a tougher question: is recent momentum ignoring long term cash flow reality?
Look into how the SWS DCF model arrives at its fair value.
Simply Wall St performs a discounted cash flow (DCF) on every stock in the world every day (check out Federal National Mortgage Association for example). We show the entire calculation in full. You can track the result in your watchlist or portfolio and be alerted when this changes, or use our stock screener to discover 904 undervalued stocks based on their cash flows. If you save a screener we even alert you when new companies match - so you never miss a potential opportunity.
Build Your Own Federal National Mortgage Association Narrative
If you see the story differently, or want to stress test the assumptions yourself, you can build a fresh view in just minutes: Do it your way.
A great starting point for your Federal National Mortgage Association research is our analysis highlighting 1 key reward and 2 important warning signs that could impact your investment decision.
Looking for more investment ideas?
Before momentum shifts again, put your watchlist to work by hunting for fresh opportunities on Simply Wall Street that match your risk appetite and return goals.
- Lock in potential mispricings by scanning these 904 undervalued stocks based on cash flows that the market may be overlooking despite strong underlying cash flows.
- Tap into structural growth trends by focusing on these 29 healthcare AI stocks shaping the future of diagnostics, treatment, and hospital efficiency.
- Position yourself for asymmetric upside with these 80 cryptocurrency and blockchain stocks riding the expansion of digital assets, infrastructure, and real world blockchain adoption.
This article by Simply Wall St is general in nature. We provide commentary based on historical data and analyst forecasts only using an unbiased methodology and our articles are not intended to be financial advice. It does not constitute a recommendation to buy or sell any stock, and does not take account of your objectives, or your financial situation. We aim to bring you long-term focused analysis driven by fundamental data. Note that our analysis may not factor in the latest price-sensitive company announcements or qualitative material. Simply Wall St has no position in any stocks mentioned.
Have feedback on this article? Concerned about the content? Get in touch with us directly. Alternatively, email editorial-team@simplywallst.com