
Assessing Oceaneering International’s Valuation After Subsea Contract Wins and Choppy 2025 Share Performance
- If you are wondering whether Oceaneering International is quietly becoming good value after a volatile few years, you are not alone. That is exactly what we are going to unpack here.
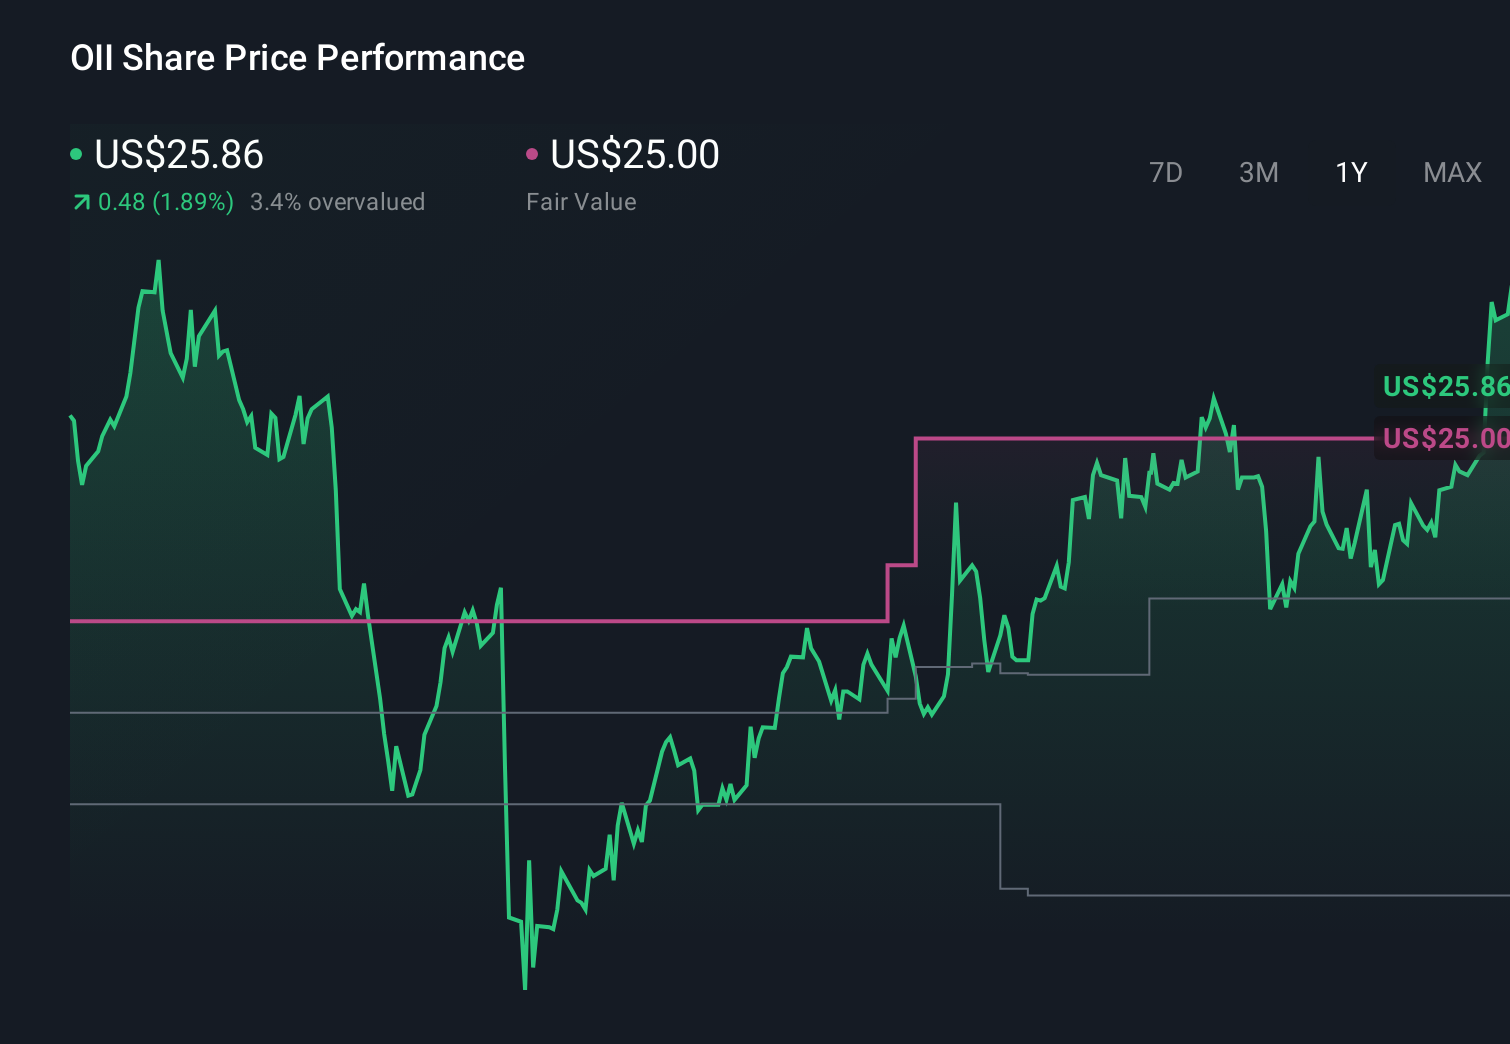
- The share price has been choppy, with gains of 1.0% over the last week and 0.4% over the last month, but it is still down 10.5% year to date and 3.0% over the past year despite being up 46.6% in 3 years and 205.3% in 5 years.
- Recent trading has been shaped by a mix of contract wins in offshore energy services and growing interest in subsea robotics and integrity management solutions, which bolster the company’s long term backlog and earnings visibility. At the same time, shifting expectations around offshore spending cycles and day rate dynamics have kept risk perceptions elevated, which helps explain the more muted share price over the last year.
- Right now, Oceaneering scores a 4/6 valuation check, indicating it screens as undervalued on most of our metrics but not all. In the next sections, we will break down what different valuation methods say about the stock, then finish with a more nuanced way to think about fair value that goes beyond any single model.
Approach 1: Oceaneering International Discounted Cash Flow (DCF) Analysis
A Discounted Cash Flow model estimates what a company is worth today by projecting its future cash flows and discounting them back to a present value. For Oceaneering International, the model uses a 2 Stage Free Cash Flow to Equity approach, starting from last twelve month free cash flow of about $111 million.
Analysts forecast free cash flow to grow to roughly $232 million by 2029, with further increases extrapolated by Simply Wall St out to 2035. These projections, all in $, are then discounted back using a required return to reflect risk and the time value of money.
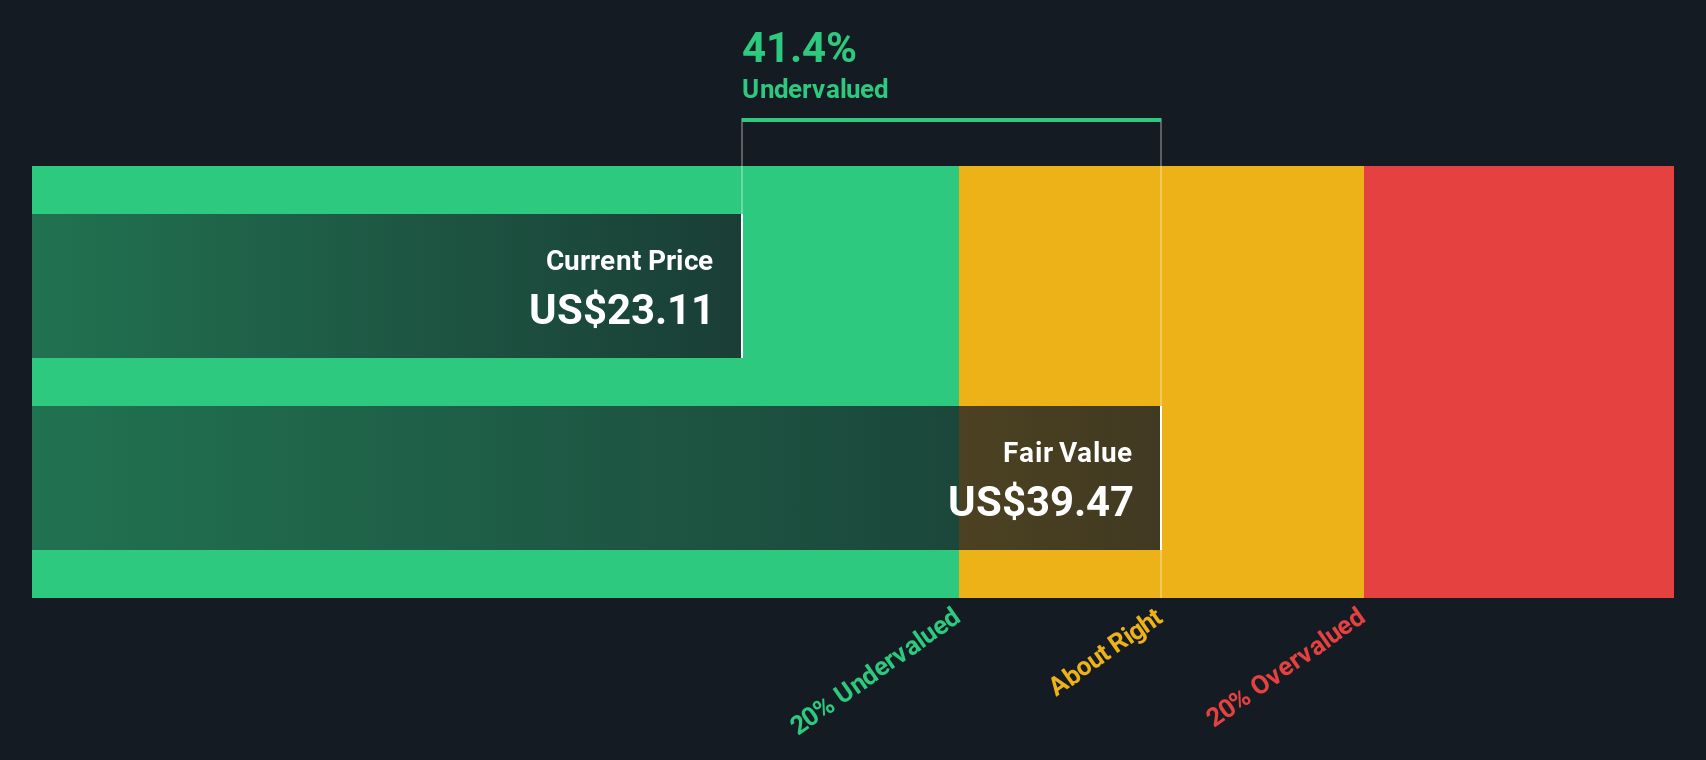
On this basis, the DCF model arrives at an intrinsic value of about $51.12 per share. Compared with the current share price, this implies the stock is trading at roughly a 52.5% discount to its estimated fair value. This indicates the shares may be attractively priced if the cash flow assumptions are broadly met.
Result: UNDERVALUED
Our Discounted Cash Flow (DCF) analysis suggests Oceaneering International is undervalued by 52.5%. Track this in your watchlist or portfolio, or discover 901 more undervalued stocks based on cash flows.
Approach 2: Oceaneering International Price vs Earnings
For a profitable company like Oceaneering, the price to earnings, or PE, ratio is a useful way to gauge how much investors are paying for each dollar of current profit. In general, faster growing and lower risk businesses can justify a higher PE, while slower growth, more cyclical or riskier companies tend to trade on lower multiples.
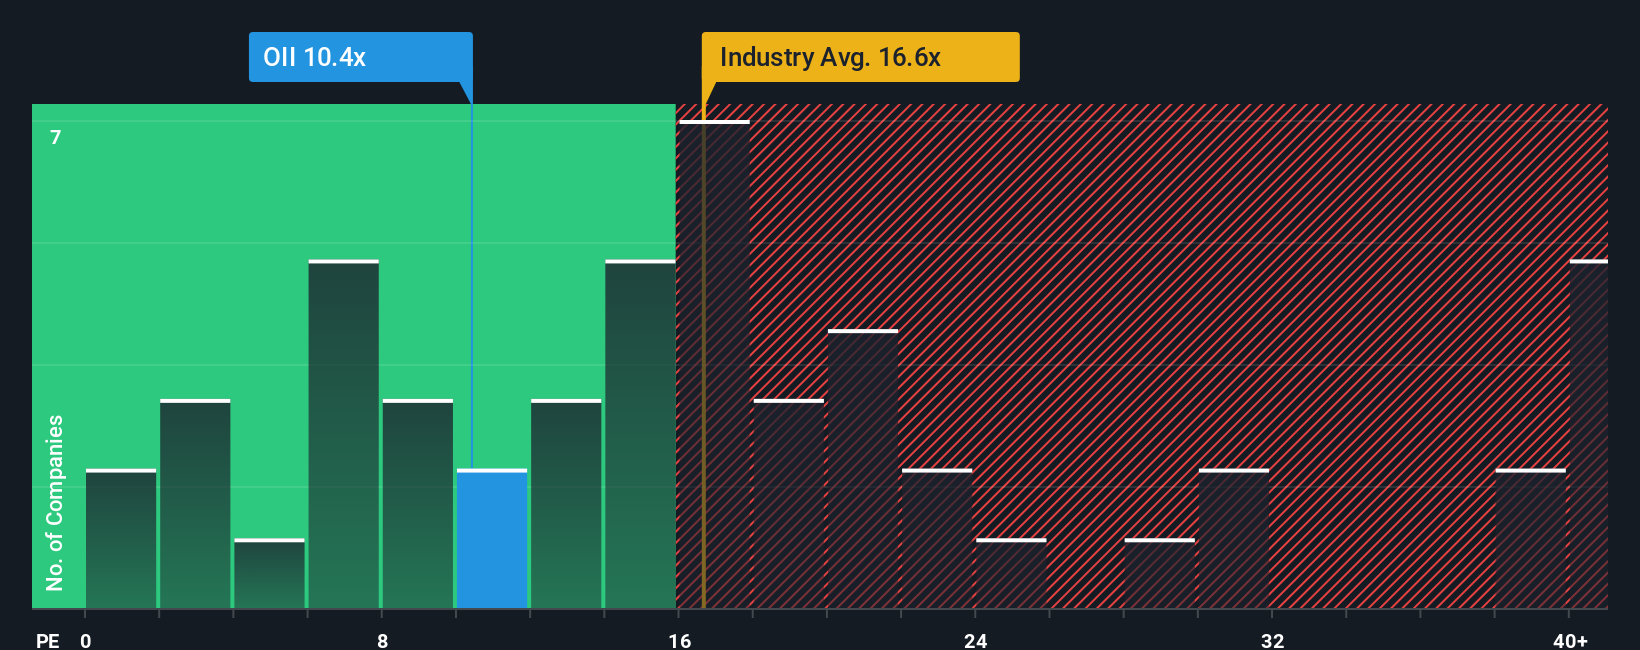
Oceaneering currently trades on a PE of about 10.4x, which is well below both the Energy Services industry average of roughly 18.1x and the wider peer group average of around 32.1x. Rather than relying only on these broad comparisons, Simply Wall St also calculates a Fair Ratio, which is its proprietary view of what a reasonable PE should be once it factors in the company’s earnings growth outlook, profitability, risk profile, industry positioning and market capitalization.
This Fair Ratio framework is more tailored than a simple peer or sector comparison because it adjusts for the specific strengths and vulnerabilities of Oceaneering’s business. On this basis, the stock’s current 10.4x PE sits meaningfully below the Fair Ratio estimate, which suggests investors are not fully pricing in its earnings power and growth potential.
Result: UNDERVALUED
PE ratios tell one story, but what if the real opportunity lies elsewhere? Discover 1459 companies where insiders are betting big on explosive growth.
Upgrade Your Decision Making: Choose your Oceaneering International Narrative
Earlier we mentioned that there is an even better way to understand valuation, so let us introduce you to Narratives, a simple way to connect your view of Oceaneering International’s future with a concrete forecast and fair value on Simply Wall St’s Community page, which is used by millions of investors. A Narrative is the story you believe about a company, translated into numbers like future revenue, earnings and margins, so that the company’s business outlook flows into a financial model and then into an explicit fair value per share. Narratives help you decide when to buy or sell by constantly comparing your Fair Value to the live market price, and they automatically update as new information, such as news or earnings releases, comes in. For example, one Oceaneering Narrative might be cautious, focusing on the energy transition and a fair value closer to the lower analyst target of about $17.50. Another, more optimistic, Narrative leans into defense, robotics and digital growth and lands nearer the top end of analyst estimates, around $25.00. Together, these give you a clear, personalized way to act on your own convictions.
Do you think there's more to the story for Oceaneering International? Head over to our Community to see what others are saying!
This article by Simply Wall St is general in nature. We provide commentary based on historical data and analyst forecasts only using an unbiased methodology and our articles are not intended to be financial advice. It does not constitute a recommendation to buy or sell any stock, and does not take account of your objectives, or your financial situation. We aim to bring you long-term focused analysis driven by fundamental data. Note that our analysis may not factor in the latest price-sensitive company announcements or qualitative material. Simply Wall St has no position in any stocks mentioned.
Have feedback on this article? Concerned about the content? Get in touch with us directly. Alternatively, email editorial-team@simplywallst.com