
Has Teva’s Surging Share Price Outpaced Its Long Term Recovery Prospects?
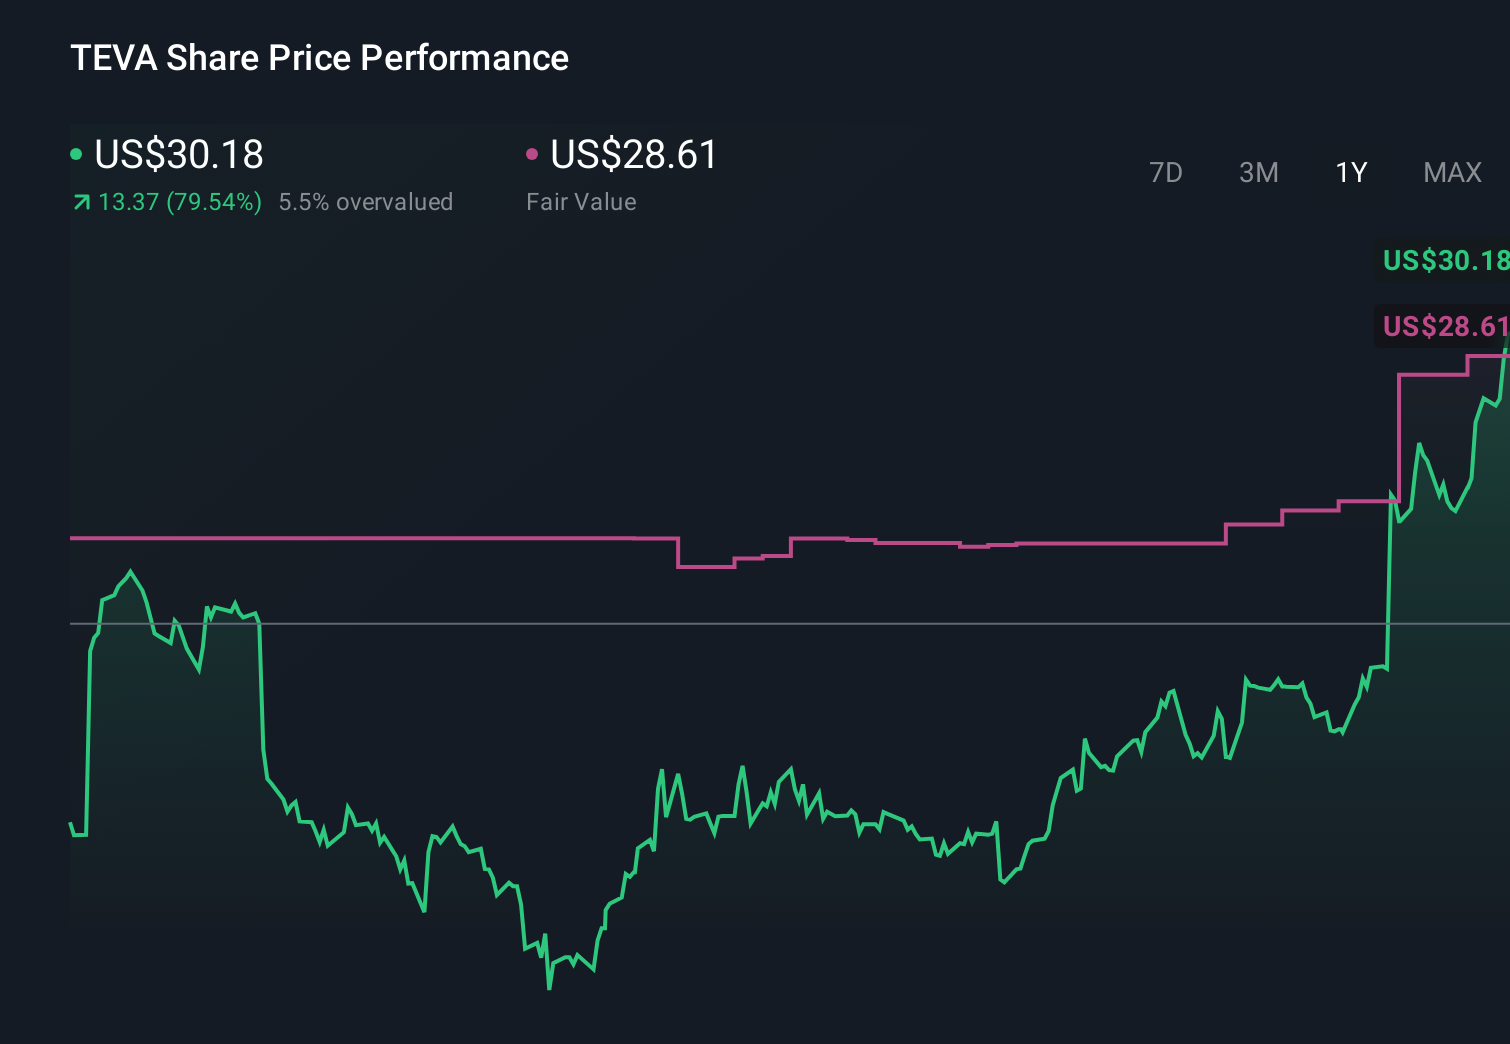
- If you are wondering whether Teva Pharmaceutical Industries is still good value after its big comeback, you are not alone. This stock has quietly shifted from a turnaround story to a serious contender on many investors' watchlists.
- Teva shares now trade around 31.74, after climbing 5.6% over the last week, 28.1% over the past month, 49.0% year to date and 41.6% over the last year, with a 245.8% gain over three years and 230.6% over five years reshaping how the market views its prospects.
- Behind those moves, investors have been reacting to Teva's ongoing debt reduction efforts and its strategic push into higher value branded and biosimilar drugs, which together are seen as improving the company’s long term risk profile. In addition, progress in resolving legacy legal overhangs and the market’s renewed interest in large generic manufacturers have helped re rate the shares as investors reassess what Teva could be worth in a more stable future.
- Even after this run, Teva only scores 2 out of 6 on our valuation checks, so the key question is whether traditional metrics are missing something important. Next, we will break down how Teva looks under different valuation approaches, and later circle back to a more powerful way of understanding what the market may really be pricing in.
Teva Pharmaceutical Industries scores just 2/6 on our valuation checks. See what other red flags we found in the full valuation breakdown.
Approach 1: Teva Pharmaceutical Industries Discounted Cash Flow (DCF) Analysis
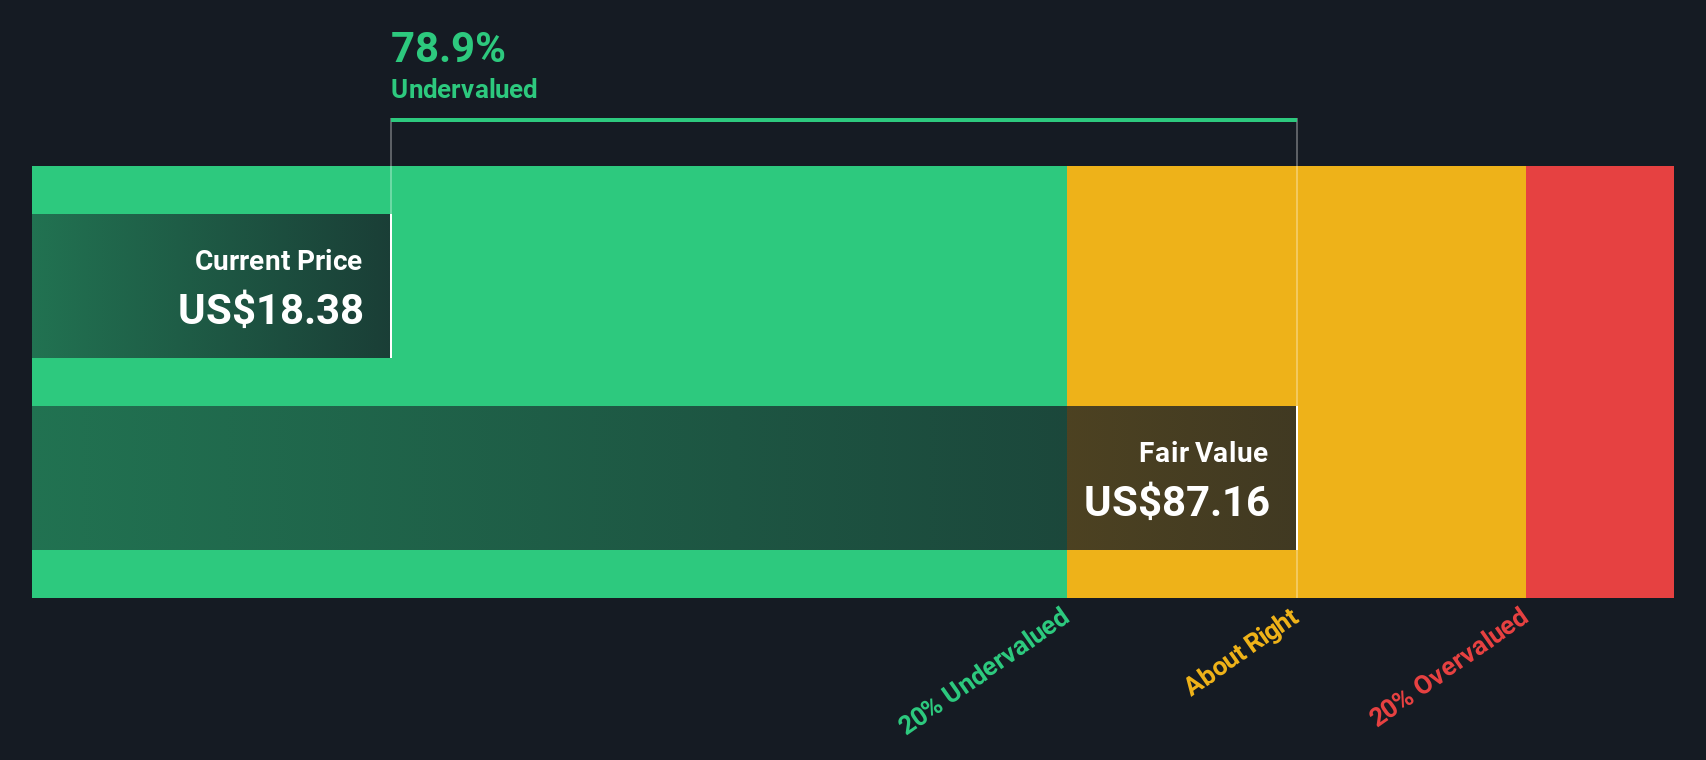
A Discounted Cash Flow model estimates what a company is worth by projecting the cash it can generate in the future and then discounting those cash flows back to today in dollar terms. For Teva Pharmaceutical Industries, the 2 Stage Free Cash Flow to Equity model starts with last twelve months free cash flow of about $0.54 billion and projects this to rise meaningfully over time.
Analyst forecasts see free cash flow reaching roughly $2.86 billion by 2026, with continued growth to about $4.49 billion by 2029 and close to $5.95 billion by 2035, with later years extrapolated beyond formal analyst coverage. When all of those projected cash flows are discounted back to today, the model arrives at an intrinsic value of about $70.98 per share.
Compared with the current share price of roughly $31.74, the DCF suggests the stock is trading at a 55.3% discount and therefore appears materially undervalued based on these long term cash generation projections.
Result: UNDERVALUED
Our Discounted Cash Flow (DCF) analysis suggests Teva Pharmaceutical Industries is undervalued by 55.3%. Track this in your watchlist or portfolio, or discover 901 more undervalued stocks based on cash flows.
Approach 2: Teva Pharmaceutical Industries Price vs Earnings
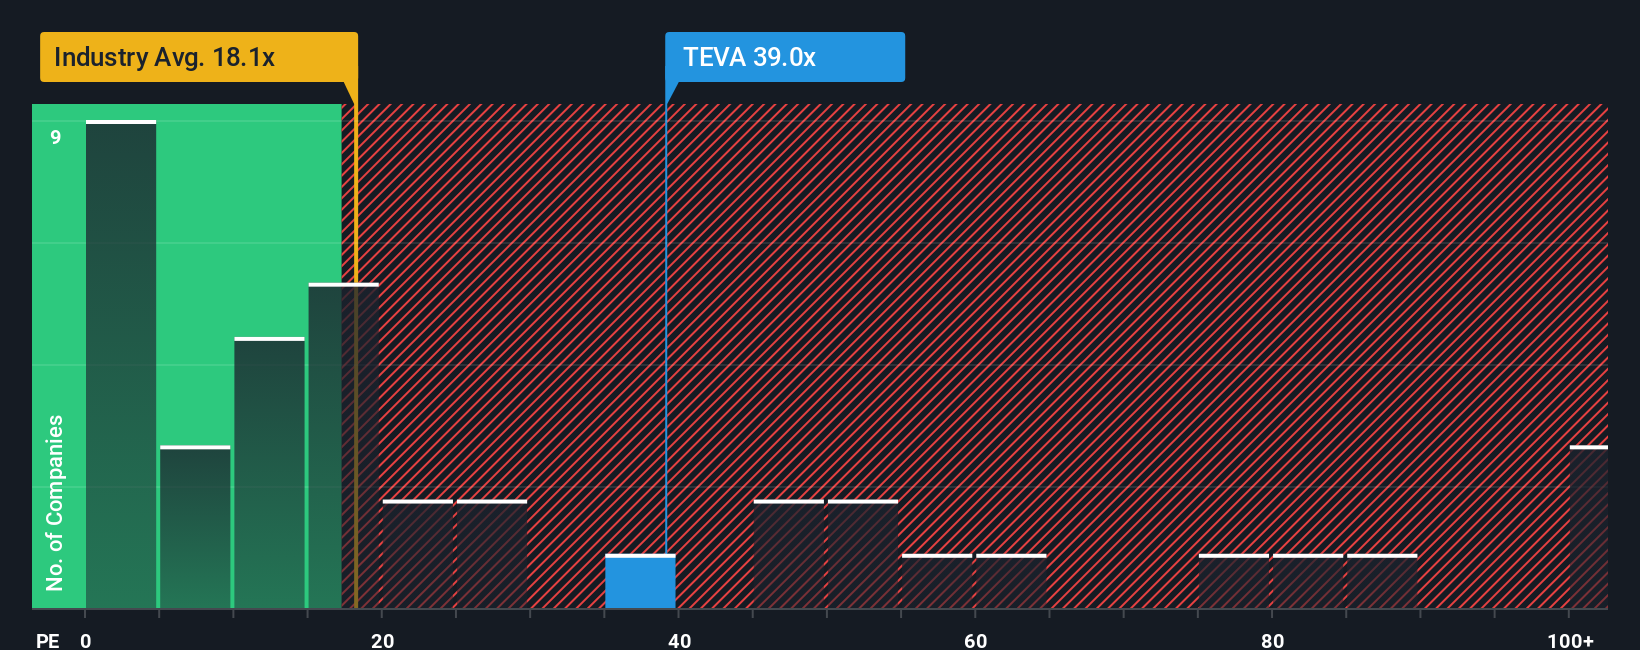
For a profitable business like Teva, the price to earnings ratio is a useful snapshot of how much investors are willing to pay for each dollar of today’s earnings. In general, faster growth and lower perceived risk justify a higher PE multiple, while slower growth or higher uncertainty usually drag that multiple down.
Teva currently trades on a PE of about 51.1x, which is well above both the Pharmaceuticals industry average of roughly 19.9x and the peer group average of around 36.3x. At face value, that suggests the market is baking in optimistic expectations about Teva’s earnings growth and risk profile. However, Simply Wall St’s Fair Ratio framework goes a step further by estimating what PE Teva should trade on, given its specific earnings growth outlook, margins, industry, size and company specific risks.
On that basis, Teva’s Fair Ratio is 26.4x, which is materially lower than the current 51.1x multiple. This indicates that, once growth prospects and risks are adjusted for in a consistent way, the shares look stretched relative to what would be considered a more balanced valuation.
Result: OVERVALUED
PE ratios tell one story, but what if the real opportunity lies elsewhere? Discover 1459 companies where insiders are betting big on explosive growth.
Upgrade Your Decision Making: Choose your Teva Pharmaceutical Industries Narrative
Earlier we mentioned that there is an even better way to understand valuation, so let's introduce you to Narratives, a simple framework on Simply Wall St's Community page that lets you attach your own story about Teva Pharmaceutical Industries to the numbers by connecting your assumptions for future revenue, earnings and margins to a financial forecast. This turns that into a Fair Value estimate, and then helps you decide when to buy or sell by comparing that Fair Value to the current price, all while staying dynamically updated as new news or earnings arrive. For example, one investor might build a bullish Teva Narrative around accelerating branded drug growth, stronger margins and a Fair Value closer to 32.77, while a more cautious investor could emphasize generic competition, debt and regulatory risk to arrive at a lower Fair Value near 18. Both can transparently see how their different stories flow through to different forecasts, valuations and ultimately decisions.
Do you think there's more to the story for Teva Pharmaceutical Industries? Head over to our Community to see what others are saying!
This article by Simply Wall St is general in nature. We provide commentary based on historical data and analyst forecasts only using an unbiased methodology and our articles are not intended to be financial advice. It does not constitute a recommendation to buy or sell any stock, and does not take account of your objectives, or your financial situation. We aim to bring you long-term focused analysis driven by fundamental data. Note that our analysis may not factor in the latest price-sensitive company announcements or qualitative material. Simply Wall St has no position in any stocks mentioned.
Have feedback on this article? Concerned about the content? Get in touch with us directly. Alternatively, email editorial-team@simplywallst.com