
Is It Too Late To Invest In Manulife After Its Strong Multi Year Share Price Rally?
- If you are wondering whether Manulife Financial is still good value after a big multi year run, you are not alone. That is exactly what we will unpack here.
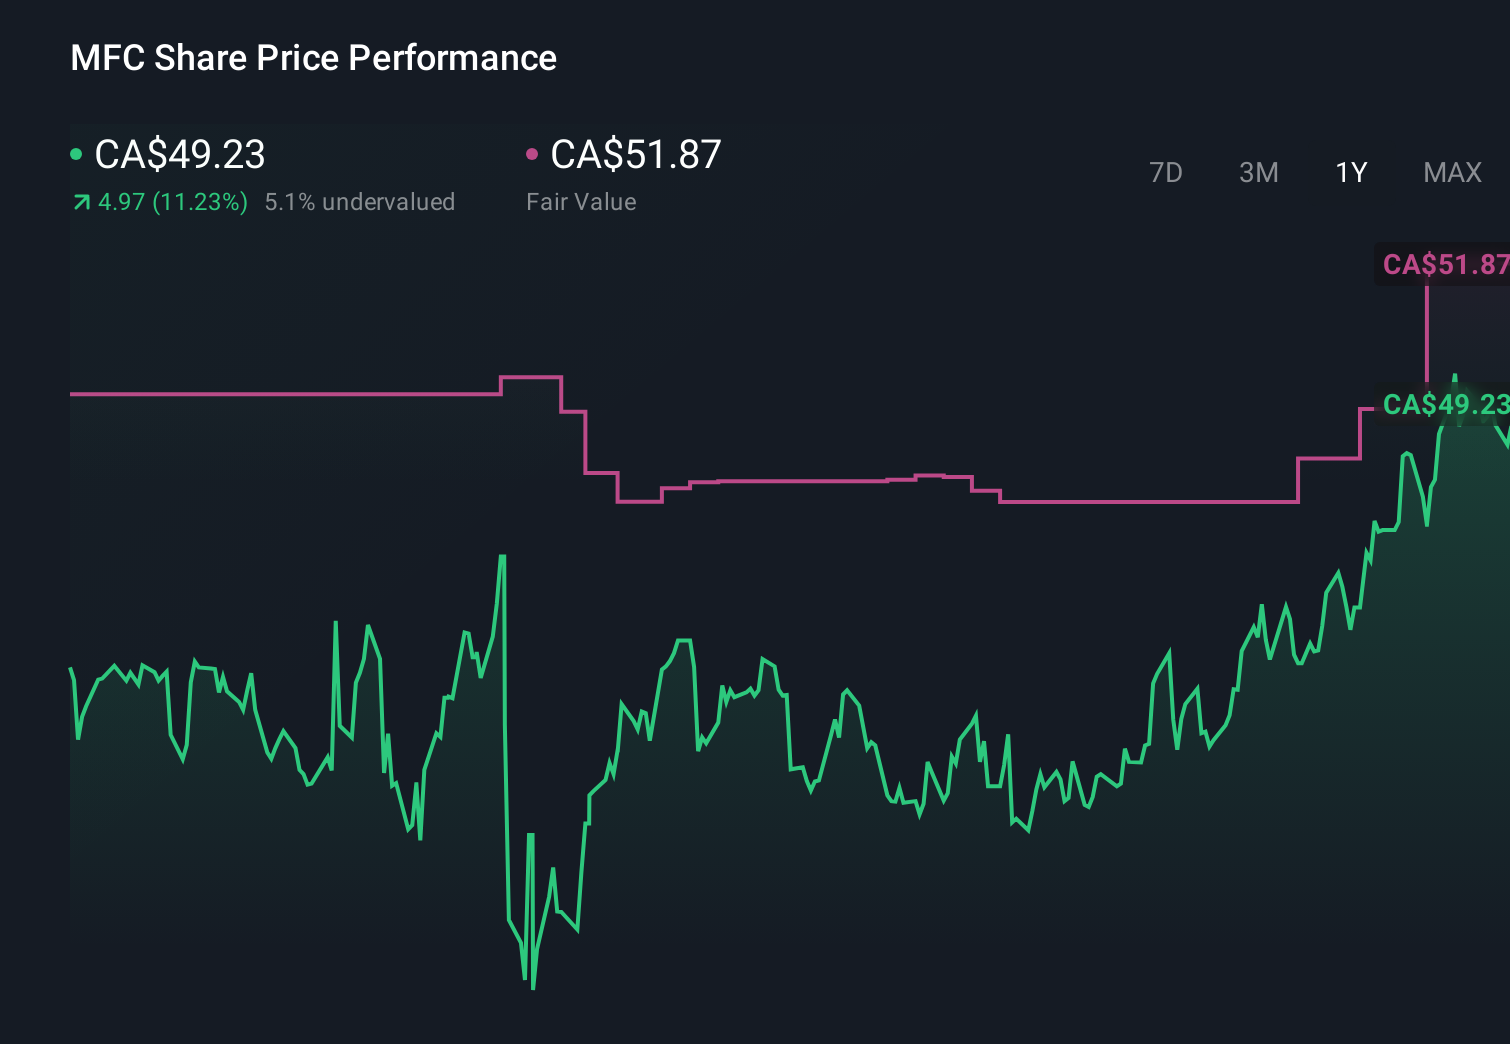
- The stock has climbed 2.1% over the last week, 14.1% year to date and an impressive 183.6% over five years, shifting how many investors think about both its growth potential and its risk profile.
- Over the past year, Manulife has stayed in the spotlight with ongoing balance sheet resilience, capital returns to shareholders and strategic pushes to grow its global wealth and asset management footprint. All of this helps explain the strong 18.4% 1 year gain. At the same time, a higher interest rate backdrop and sector wide optimism around insurers have given investors more confidence in the sustainability of those returns.
- Despite that strength, Manulife only scores a 3/6 valuation check score, suggesting the market may not be offering a clear cut bargain yet. In the rest of this article we will walk through different valuation approaches, then finish with a more holistic way to think about what Manulife is really worth.
Find out why Manulife Financial's 18.4% return over the last year is lagging behind its peers.
Approach 1: Manulife Financial Excess Returns Analysis
The Excess Returns model looks at how much profit a company generates above the minimum return investors require on its equity, then projects and values those extra gains per share.
For Manulife, the starting point is its balance sheet. Book Value sits at about CA$28.96 per share, with analysts expecting a Stable Book Value of roughly CA$28.50 per share, based on forecasts from six analysts. On that equity base, Manulife is projected to earn Stable EPS of about CA$4.70 per share, derived from future Return on Equity estimates from eight analysts. This implies an Average Return on Equity of 16.49%.
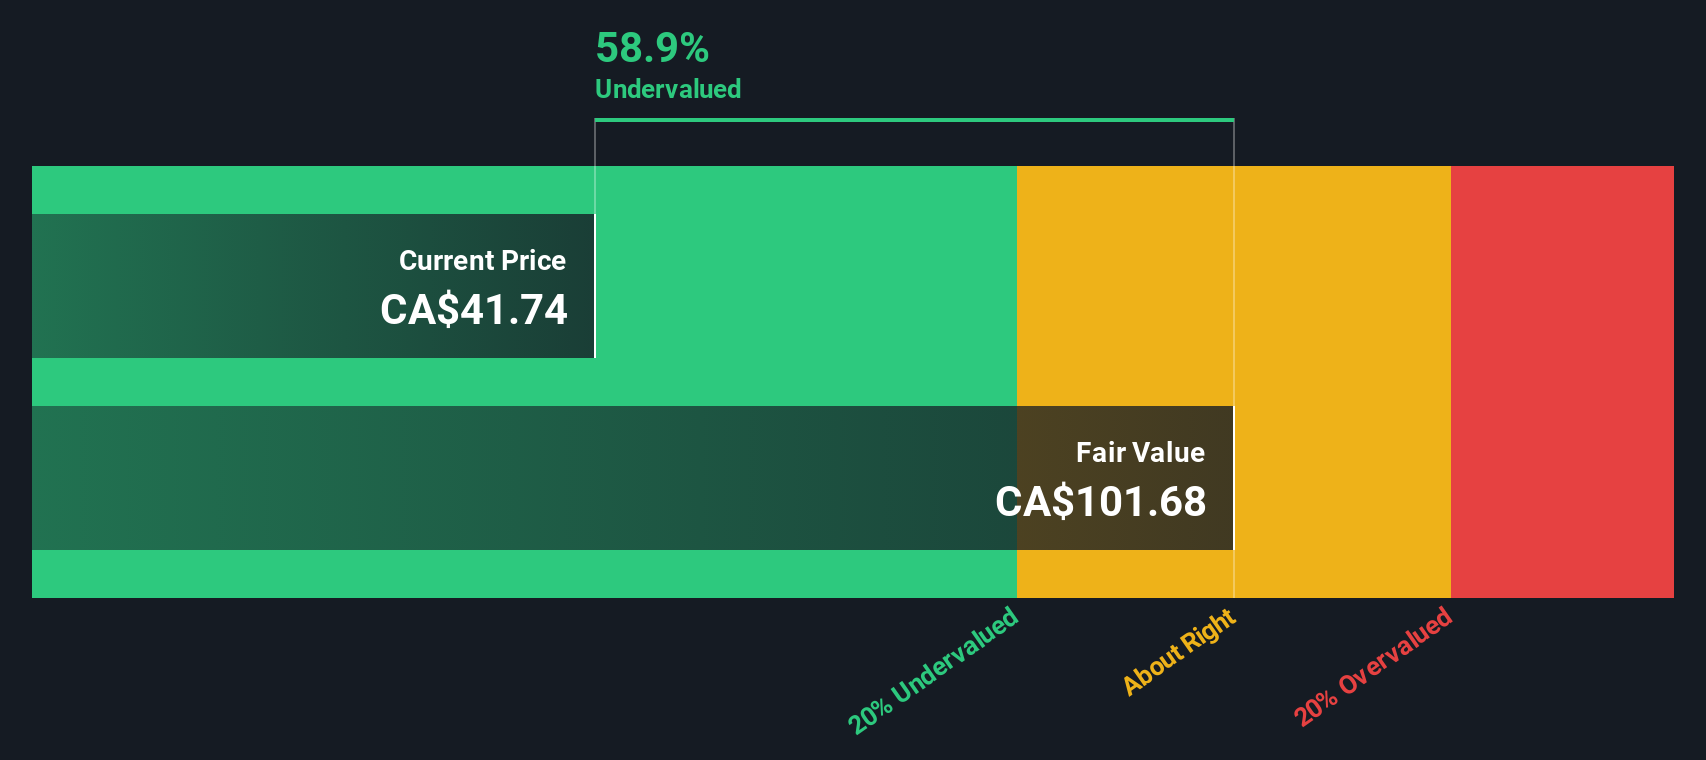
The model assumes investors require a Cost of Equity of roughly CA$1.74 per share, leaving an Excess Return of around CA$2.96 per share. When those excess earnings are projected forward and discounted, Simply Wall St estimates an intrinsic value that implies the shares are trading at about a 56.9% discount.
In summary, based on this framework of returns on equity and growth, Manulife appears meaningfully undervalued rather than fully priced.
Result: UNDERVALUED
Our Excess Returns analysis suggests Manulife Financial is undervalued by 56.9%. Track this in your watchlist or portfolio, or discover 901 more undervalued stocks based on cash flows.
Approach 2: Manulife Financial Price vs Earnings
For a mature, consistently profitable insurer like Manulife, the price to earnings ratio is a sensible way to gauge value because it links what investors pay today directly to the profits the business is generating right now. In general, faster growth and lower perceived risk justify a higher normal PE multiple, while slower growth or higher risk call for a discount.
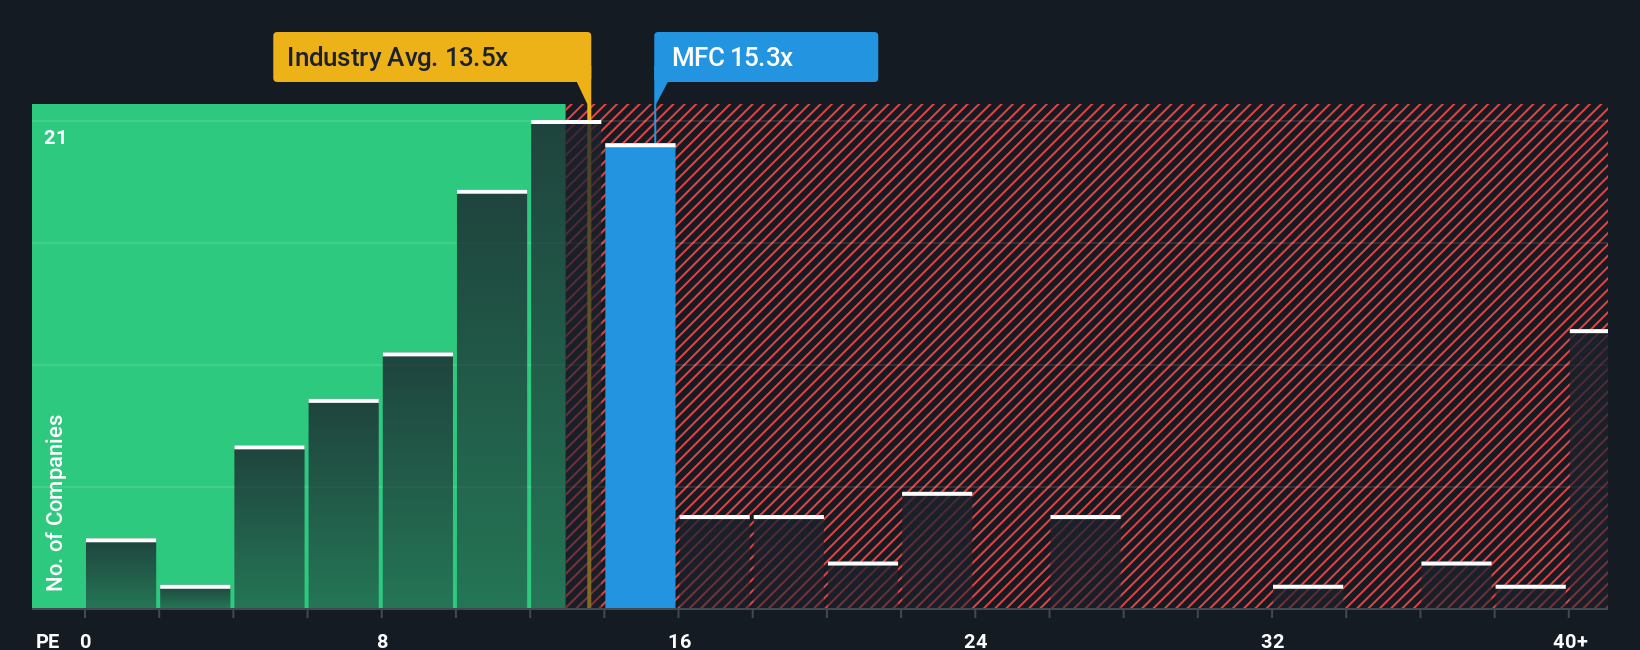
Manulife currently trades on a PE of about 15.6x. That is above the wider Insurance industry average of roughly 11.8x, but broadly in line with its direct peer group at around 15.3x. To move beyond simple comparisons, Simply Wall St estimates a Fair Ratio of about 16.0x, which reflects Manulife’s specific earnings growth outlook, profitability, risk profile, industry positioning and market cap. This tailored Fair Ratio is more informative than a plain peer or sector check because it adjusts for what actually makes Manulife different.
With the current 15.6x multiple sitting slightly below the 16.0x Fair Ratio, the shares appear modestly undervalued on earnings.
Result: UNDERVALUED
PE ratios tell one story, but what if the real opportunity lies elsewhere? Discover 1459 companies where insiders are betting big on explosive growth.
Upgrade Your Decision Making: Choose your Manulife Financial Narrative
Earlier we mentioned that there is an even better way to understand valuation. Let us introduce you to Narratives, a simple tool on Simply Wall St’s Community page that lets you turn your view of Manulife into a story linked to concrete forecasts and a Fair Value. You can then compare that Fair Value with today’s share price to decide whether to buy, hold, or sell. The platform keeps your Narrative up to date as new news or earnings arrive. For example, one investor might build a bullish Narrative assuming Manulife’s Asia expansion and digital initiatives support revenue growth of around 23% a year, margins near 14% and a Fair Value above CA$50 per share. A more cautious investor might stress risks around regulation, credit quality, and integration, assume slower growth, lower margins, and a Fair Value closer to CA$39. Both investors are using the same company but different stories, each translated into numbers that can make their decisions clearer and more disciplined.
Do you think there's more to the story for Manulife Financial? Head over to our Community to see what others are saying!
This article by Simply Wall St is general in nature. We provide commentary based on historical data and analyst forecasts only using an unbiased methodology and our articles are not intended to be financial advice. It does not constitute a recommendation to buy or sell any stock, and does not take account of your objectives, or your financial situation. We aim to bring you long-term focused analysis driven by fundamental data. Note that our analysis may not factor in the latest price-sensitive company announcements or qualitative material. Simply Wall St has no position in any stocks mentioned.
Have feedback on this article? Concerned about the content? Get in touch with us directly. Alternatively, email editorial-team@simplywallst.com