
Peloton (PTON) Valuation Check After Recent Share Price Slide and Turnaround Doubts
Peloton Interactive (PTON) has had a rough stretch in the market, with the stock sliding over the past year even as annual revenue and net income trends show early signs of stabilizing off earlier lows.
See our latest analysis for Peloton Interactive.
At around $6.11 per share, Peloton’s recent slide, including a steep 90 day share price return of negative 28.66 percent, signals fading momentum as investors reassess both its turnaround prospects and ongoing execution risks after earlier growth missteps.
If Peloton’s reset has you reconsidering where growth and resilience might come from next, it could be worth exploring fast growing stocks with high insider ownership as a fresh hunting ground for ideas.
With shares trading at a steep discount to analyst targets, yet weighed down by losses and execution risks, is Peloton now an undervalued turnaround story, or is the market correctly pricing in muted future growth?
Most Popular Narrative: 41.4% Undervalued
With Peloton last closing at $6.11 versus a narrative fair value around $10.43, the story leans heavily toward a multi year recovery path.
The long-term proliferation of connected devices and IoT, coupled with increased remote/hybrid work, creates continued tailwinds for at-home and digitally connected fitness solutions, enhancing Peloton's total addressable market and supporting a return to sustainable revenue and earnings growth if the company executes effectively.
Curious how flat topline expectations can still support a richer future profit profile, rising margins, and a premium earnings multiple well above leisure peers? Unlock the full playbook behind this valuation.
Result: Fair Value of $10.43 (UNDERVALUED)
Have a read of the narrative in full and understand what's behind the forecasts.
However, persistent hardware and subscription declines, alongside intensifying competition, could derail margin expansion and undermine the long term recovery narrative.
Find out about the key risks to this Peloton Interactive narrative.
Another Lens on Value
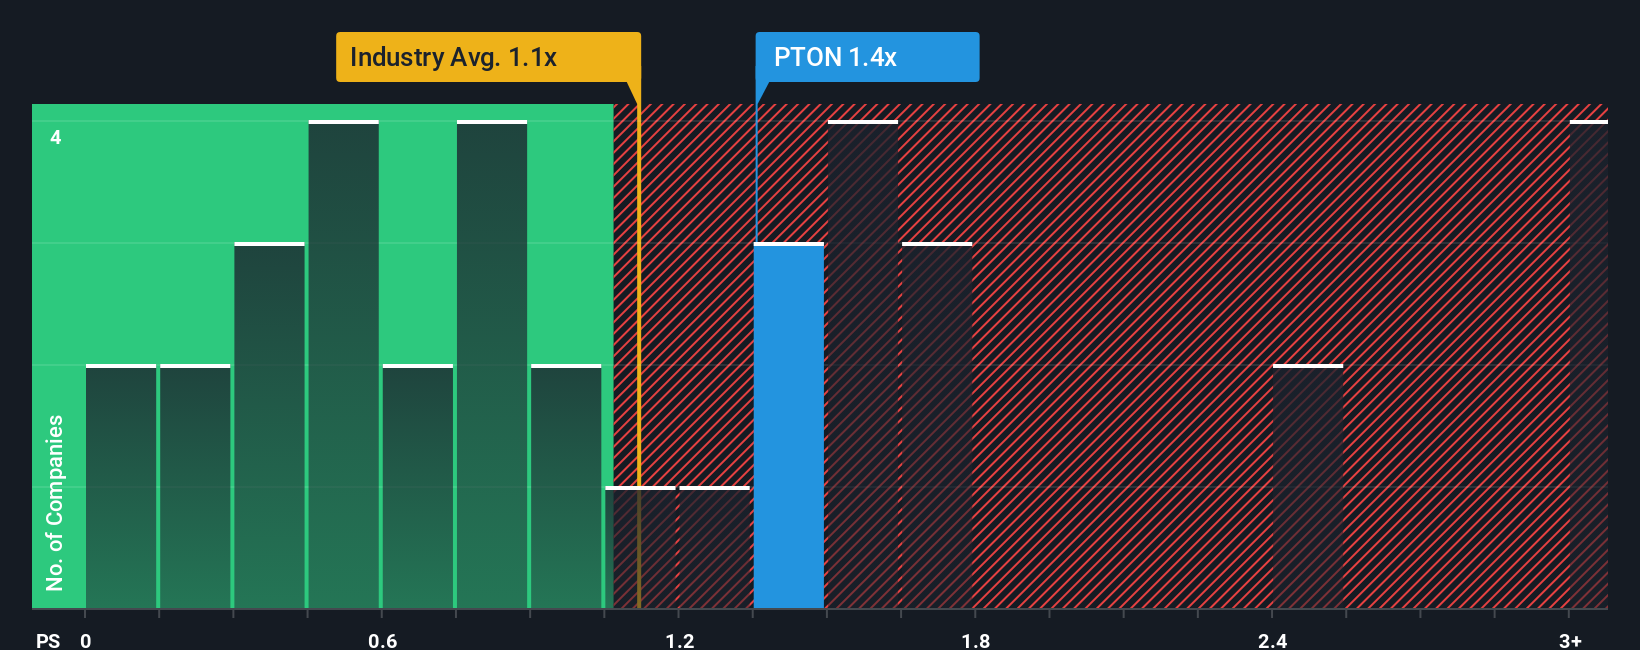
While the narrative fair value points to upside, a simple sales based view looks far less generous. Peloton trades on about 1 times revenue, roughly in line with both leisure peers and its own fair ratio, suggesting little multiple based margin of safety if growth disappoints.
See what the numbers say about this price — find out in our valuation breakdown.
Build Your Own Peloton Interactive Narrative
If you see the story differently or want to dig into the numbers yourself, you can build a custom narrative in minutes: Do it your way.
A great starting point for your Peloton Interactive research is our analysis highlighting 3 key rewards and 1 important warning sign that could impact your investment decision.
Ready for more high conviction ideas?
Do not stop at a single turnaround story. Use the Simply Wall Street Screener to uncover targeted opportunities and stay ahead while others keep reacting late.
- Lock in potential mispriced gems early by scanning these 901 undervalued stocks based on cash flows that strong cash flow analysis suggests the market is overlooking.
- Tap into powerful secular trends by reviewing these 24 AI penny stocks positioned to benefit from real world artificial intelligence adoption, not just hype.
- Strengthen your income strategy by focusing on these 10 dividend stocks with yields > 3% that combine meaningful yields with healthier fundamentals.
This article by Simply Wall St is general in nature. We provide commentary based on historical data and analyst forecasts only using an unbiased methodology and our articles are not intended to be financial advice. It does not constitute a recommendation to buy or sell any stock, and does not take account of your objectives, or your financial situation. We aim to bring you long-term focused analysis driven by fundamental data. Note that our analysis may not factor in the latest price-sensitive company announcements or qualitative material. Simply Wall St has no position in any stocks mentioned.
Have feedback on this article? Concerned about the content? Get in touch with us directly. Alternatively, email editorial-team@simplywallst.com