
With 88% institutional ownership, Selective Insurance Group, Inc. (NASDAQ:SIGI) is a favorite amongst the big guns
Key Insights
- Institutions' substantial holdings in Selective Insurance Group implies that they have significant influence over the company's share price
- A total of 10 investors have a majority stake in the company with 51% ownership
- Insiders have been buying lately
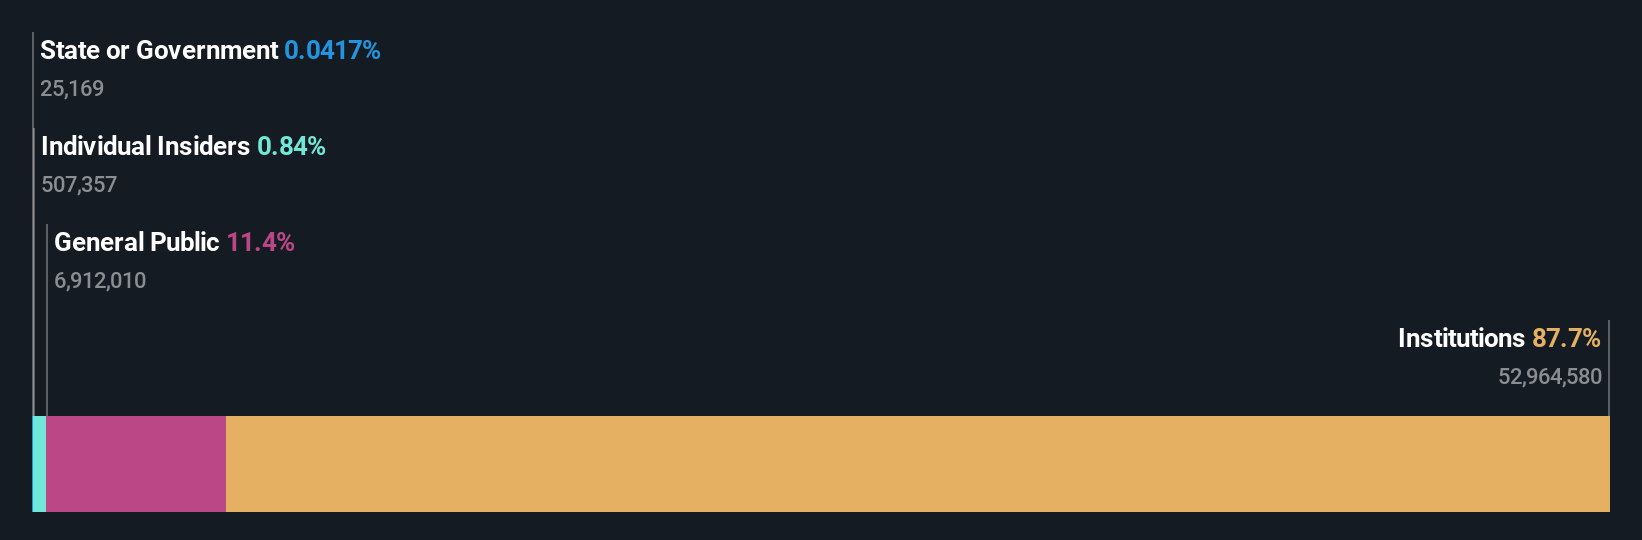
If you want to know who really controls Selective Insurance Group, Inc. (NASDAQ:SIGI), then you'll have to look at the makeup of its share registry. The group holding the most number of shares in the company, around 88% to be precise, is institutions. In other words, the group stands to gain the most (or lose the most) from their investment into the company.
Since institutional have access to huge amounts of capital, their market moves tend to receive a lot of scrutiny by retail or individual investors. Therefore, a good portion of institutional money invested in the company is usually a huge vote of confidence on its future.
Let's take a closer look to see what the different types of shareholders can tell us about Selective Insurance Group.
See our latest analysis for Selective Insurance Group
What Does The Institutional Ownership Tell Us About Selective Insurance Group?
Institutional investors commonly compare their own returns to the returns of a commonly followed index. So they generally do consider buying larger companies that are included in the relevant benchmark index.
As you can see, institutional investors have a fair amount of stake in Selective Insurance Group. This implies the analysts working for those institutions have looked at the stock and they like it. But just like anyone else, they could be wrong. When multiple institutions own a stock, there's always a risk that they are in a 'crowded trade'. When such a trade goes wrong, multiple parties may compete to sell stock fast. This risk is higher in a company without a history of growth. You can see Selective Insurance Group's historic earnings and revenue below, but keep in mind there's always more to the story.

Institutional investors own over 50% of the company, so together than can probably strongly influence board decisions. We note that hedge funds don't have a meaningful investment in Selective Insurance Group. BlackRock, Inc. is currently the company's largest shareholder with 12% of shares outstanding. The Vanguard Group, Inc. is the second largest shareholder owning 11% of common stock, and FMR LLC holds about 8.7% of the company stock.
We did some more digging and found that 10 of the top shareholders account for roughly 51% of the register, implying that along with larger shareholders, there are a few smaller shareholders, thereby balancing out each others interests somewhat.
While it makes sense to study institutional ownership data for a company, it also makes sense to study analyst sentiments to know which way the wind is blowing. There are a reasonable number of analysts covering the stock, so it might be useful to find out their aggregate view on the future.
Insider Ownership Of Selective Insurance Group
The definition of an insider can differ slightly between different countries, but members of the board of directors always count. Management ultimately answers to the board. However, it is not uncommon for managers to be executive board members, especially if they are a founder or the CEO.
I generally consider insider ownership to be a good thing. However, on some occasions it makes it more difficult for other shareholders to hold the board accountable for decisions.
Our information suggests that Selective Insurance Group, Inc. insiders own under 1% of the company. It's a big company, so even a small proportional interest can create alignment between the board and shareholders. In this case insiders own US$43m worth of shares. It is good to see board members owning shares, but it might be worth checking if those insiders have been buying.
General Public Ownership
The general public-- including retail investors -- own 11% stake in the company, and hence can't easily be ignored. This size of ownership, while considerable, may not be enough to change company policy if the decision is not in sync with other large shareholders.
Next Steps:
I find it very interesting to look at who exactly owns a company. But to truly gain insight, we need to consider other information, too.
Many find it useful to take an in depth look at how a company has performed in the past. You can access this detailed graph of past earnings, revenue and cash flow.
If you would prefer discover what analysts are predicting in terms of future growth, do not miss this free report on analyst forecasts.
NB: Figures in this article are calculated using data from the last twelve months, which refer to the 12-month period ending on the last date of the month the financial statement is dated. This may not be consistent with full year annual report figures.
Have feedback on this article? Concerned about the content? Get in touch with us directly. Alternatively, email editorial-team (at) simplywallst.com.
This article by Simply Wall St is general in nature. We provide commentary based on historical data and analyst forecasts only using an unbiased methodology and our articles are not intended to be financial advice. It does not constitute a recommendation to buy or sell any stock, and does not take account of your objectives, or your financial situation. We aim to bring you long-term focused analysis driven by fundamental data. Note that our analysis may not factor in the latest price-sensitive company announcements or qualitative material. Simply Wall St has no position in any stocks mentioned.