
Is Viper Energy (VNOM) Pricing Reflect Recent Share Weakness And Sitio Royalties Acquisition
- If you are wondering whether Viper Energy's share price really lines up with its underlying value, this article is going to walk through the key numbers that matter.
- The stock recently closed at US$36.87, with returns of 5.4% decline over 7 days, 9.3% decline over 30 days and 4.9% decline year to date, while the 1 year return sits at 22.0% decline.
- Recent coverage around Viper Energy has focused on its role within the wider US energy sector and how changing expectations for commodity prices can affect royalty and mineral interest companies like this. That context helps frame the recent share price weakness as investors reassess both potential rewards and the risks tied to future cash flows.
- On our valuation checks, Viper Energy scores 3 out of 6. You can see the breakdown of that valuation score before we compare more traditional methods like P/E, cash flow based estimates and assets, and then finish with a different way of thinking about value that pulls everything together.
Find out why Viper Energy's -22.0% return over the last year is lagging behind its peers.
Approach 1: Viper Energy Discounted Cash Flow (DCF) Analysis
A Discounted Cash Flow, or DCF, model takes projections of a company’s future cash flows and discounts them back to today’s dollars to estimate what the whole business might be worth now.
For Viper Energy, the model used is a 2 Stage Free Cash Flow to Equity approach. The latest twelve month free cash flow is a loss of $849.08 million, so the story here is built around expectations for future cash generation rather than recent cash results. Analyst and model estimates in this article indicate free cash flow of $1,467.40 million in 2026 and $1,824.00 million in 2030, with later years extrapolated by Simply Wall St rather than covered directly by analysts.
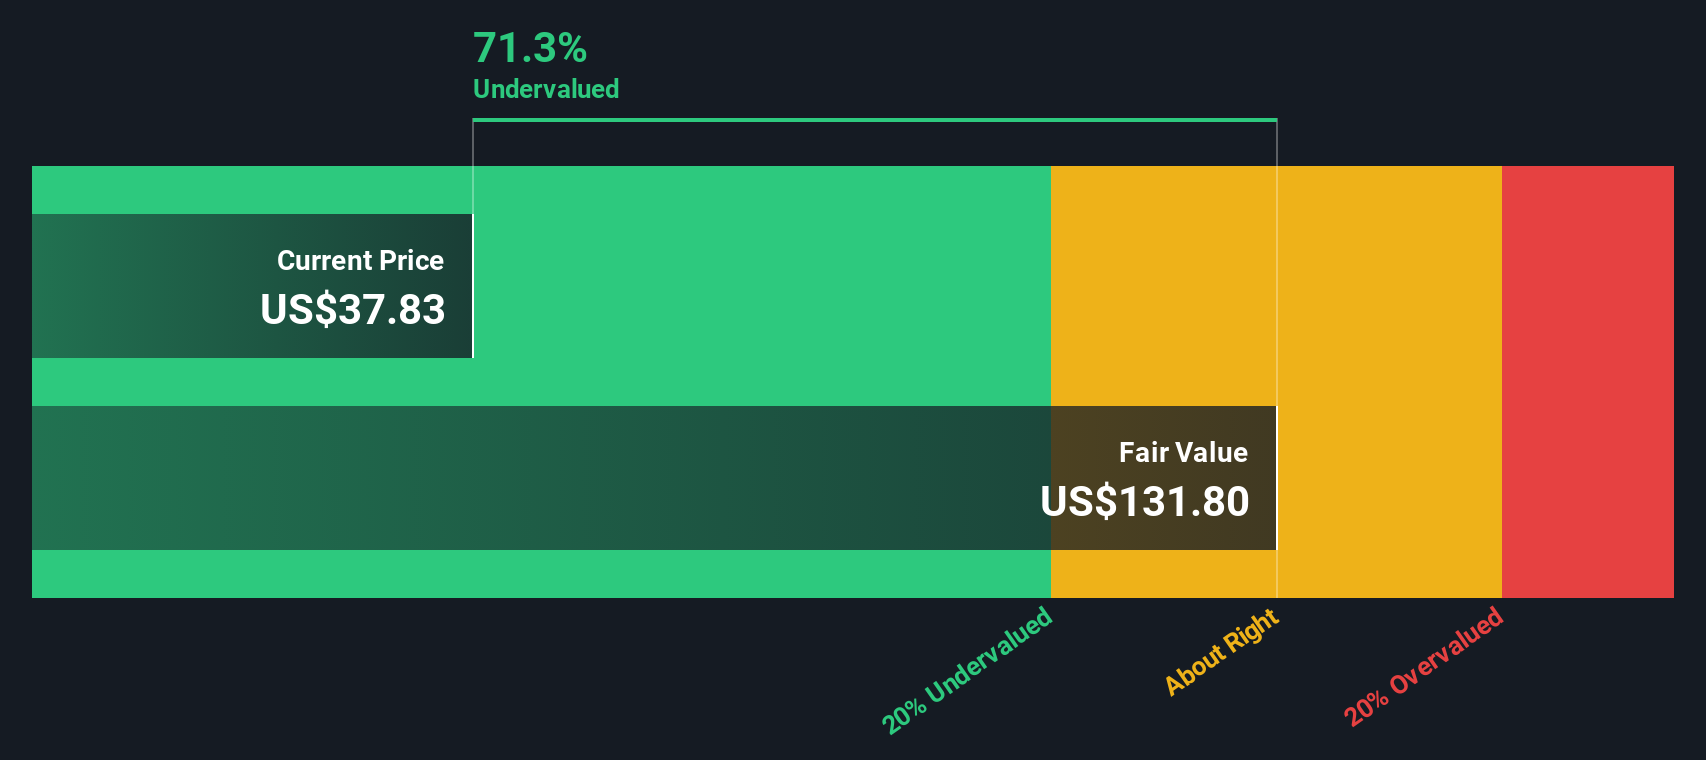
When all of those projected cash flows are discounted back, the DCF model in this article arrives at an estimated fair value of $121.97 per share. Compared with the recent share price of $36.87, that implies the stock is 69.8% undervalued on this set of assumptions.
Result: UNDERVALUED
Our Discounted Cash Flow (DCF) analysis suggests Viper Energy is undervalued by 69.8%. Track this in your watchlist or portfolio, or discover 877 more undervalued stocks based on cash flows.
Approach 2: Viper Energy Price vs Earnings
For a profitable company, the P/E ratio is a useful shortcut because it links what you pay directly to the earnings the business is already generating. Higher growth expectations or lower perceived risk tend to support a higher P/E, while slower growth or higher risk usually point to a lower, more conservative P/E as a fair level.
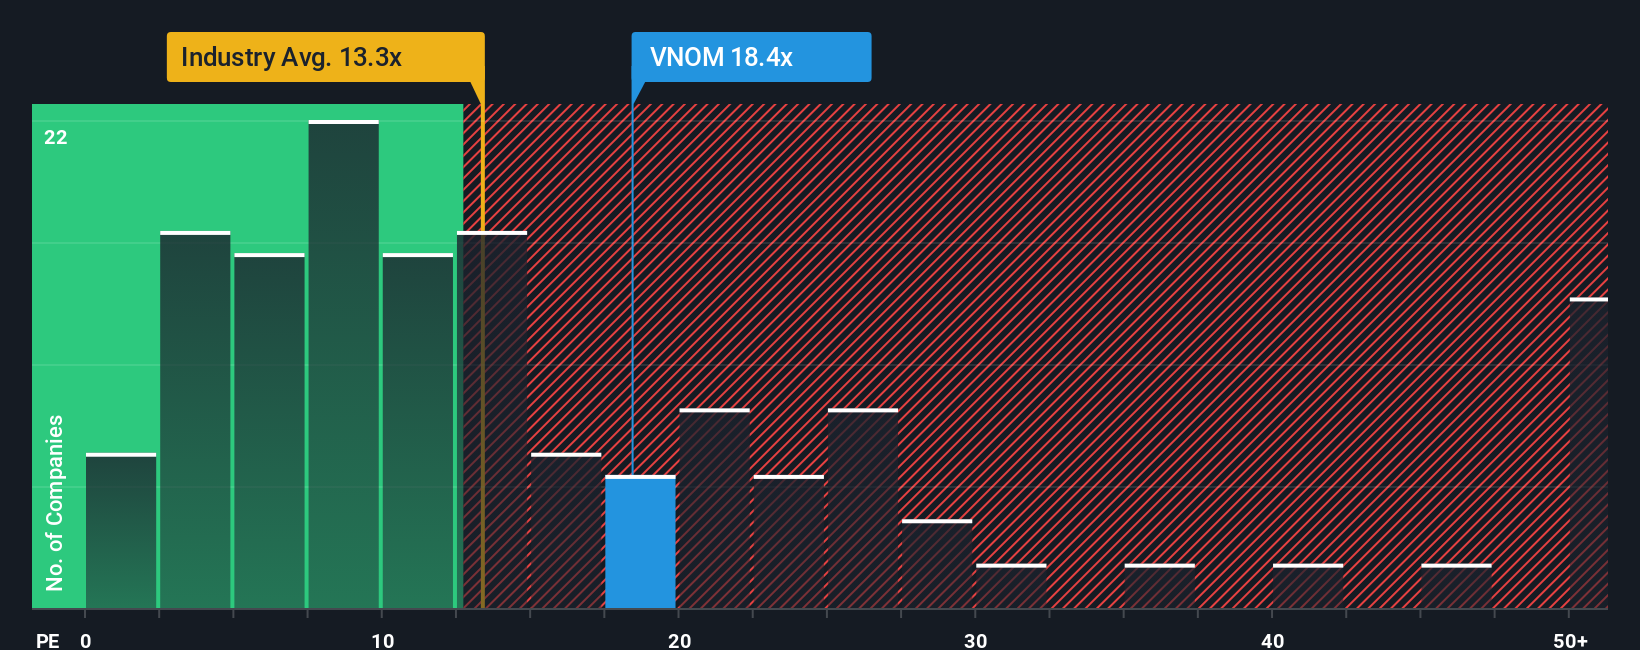
Viper Energy currently trades on a P/E of 25.43x. That sits above both the Oil and Gas industry average of 13.13x and the peer group average of 17.22x, so on simple comparisons the shares carry a richer multiple than many alternatives.
Simply Wall St’s Fair Ratio for Viper Energy is 17.83x. This is a proprietary view of what a more appropriate P/E could be once you factor in company specific elements like earnings growth, profit margins, risk profile, industry and market cap. Because it adjusts for these drivers, the Fair Ratio can offer a more tailored reference point than broad industry or peer averages alone.
Comparing the current P/E of 25.43x with the Fair Ratio of 17.83x suggests the shares are trading above that modelled fair range.
Result: OVERVALUED
P/E ratios tell one story, but what if the real opportunity lies elsewhere? Discover 1448 companies where insiders are betting big on explosive growth.
Upgrade Your Decision Making: Choose your Viper Energy Narrative
Earlier we mentioned that there is an even better way to understand valuation. On Simply Wall St you can use Narratives on the Community page to link your view of Viper Energy’s story to a financial forecast and a fair value that updates as new news or earnings arrive. For example, you can consider how the Sitio Royalties acquisition, planned non core asset sales or production guidance might shape future revenue, earnings and margins. You can then compare that personal fair value with the current share price. This is why one investor might see upside based on a fair value closer to the top analyst target of US$68, while another takes a more cautious view closer to US$44. You can pick the Narrative that best fits your own assumptions.
Do you think there's more to the story for Viper Energy? Head over to our Community to see what others are saying!

This article by Simply Wall St is general in nature. We provide commentary based on historical data and analyst forecasts only using an unbiased methodology and our articles are not intended to be financial advice. It does not constitute a recommendation to buy or sell any stock, and does not take account of your objectives, or your financial situation. We aim to bring you long-term focused analysis driven by fundamental data. Note that our analysis may not factor in the latest price-sensitive company announcements or qualitative material. Simply Wall St has no position in any stocks mentioned.
Have feedback on this article? Concerned about the content? Get in touch with us directly. Alternatively, email editorial-team@simplywallst.com