
A Look At Lennox International (LII) Valuation After Weaker Q3 And Transitional 2025 Outlook
Lennox International (LII) is back in focus after weaker Q3 results, with year-on-year revenue declines, an earnings miss, and management describing 2025 as a transitional year shaped by refrigerant changes and tougher macroeconomic conditions.
See our latest analysis for Lennox International.
The share price has been volatile around these updates, with a 3.2% 1 day share price return and 5.2% 7 day share price return, but a 6.3% 90 day share price decline and a 14.1% 1 year total shareholder return decline contrasting with a very strong 3 year total shareholder return.
If Lennox’s recent swings have you thinking about diversification, this could be a good moment to scan aerospace and defense stocks for other industrial names with different drivers.
With Lennox now trading at a discount to the average analyst price target and coming off a weaker Q3 and softer 1 year return, you have to ask: is there a mispricing here, or is the market already baking in future growth?
Most Popular Narrative: 9% Undervalued
With Lennox International closing at US$519.85 against a narrative fair value of about US$571.43, the gap immediately raises questions about what is driving the difference.
Investments in digital platforms, AI-based pricing tools, and proprietary data analytics are enabling Lennox to optimize pricing, streamline dealer interactions, and maintain premium pricing power, supporting higher net margins and recurring revenue as the HVAC industry moves toward smart, connected solutions.
Curious what earnings path and margin profile sit behind that valuation gap? The narrative leans on specific growth rates, higher profitability, and a firm view on future P/E multiples. Want to see exactly how those moving parts add up?
Result: Fair Value of $571.43 (UNDERVALUED)
Have a read of the narrative in full and understand what's behind the forecasts.
However, that potential upside sits alongside real pressure points, including softer residential demand in core markets and the risk that higher input costs could squeeze margins if pricing power weakens.
Find out about the key risks to this Lennox International narrative.
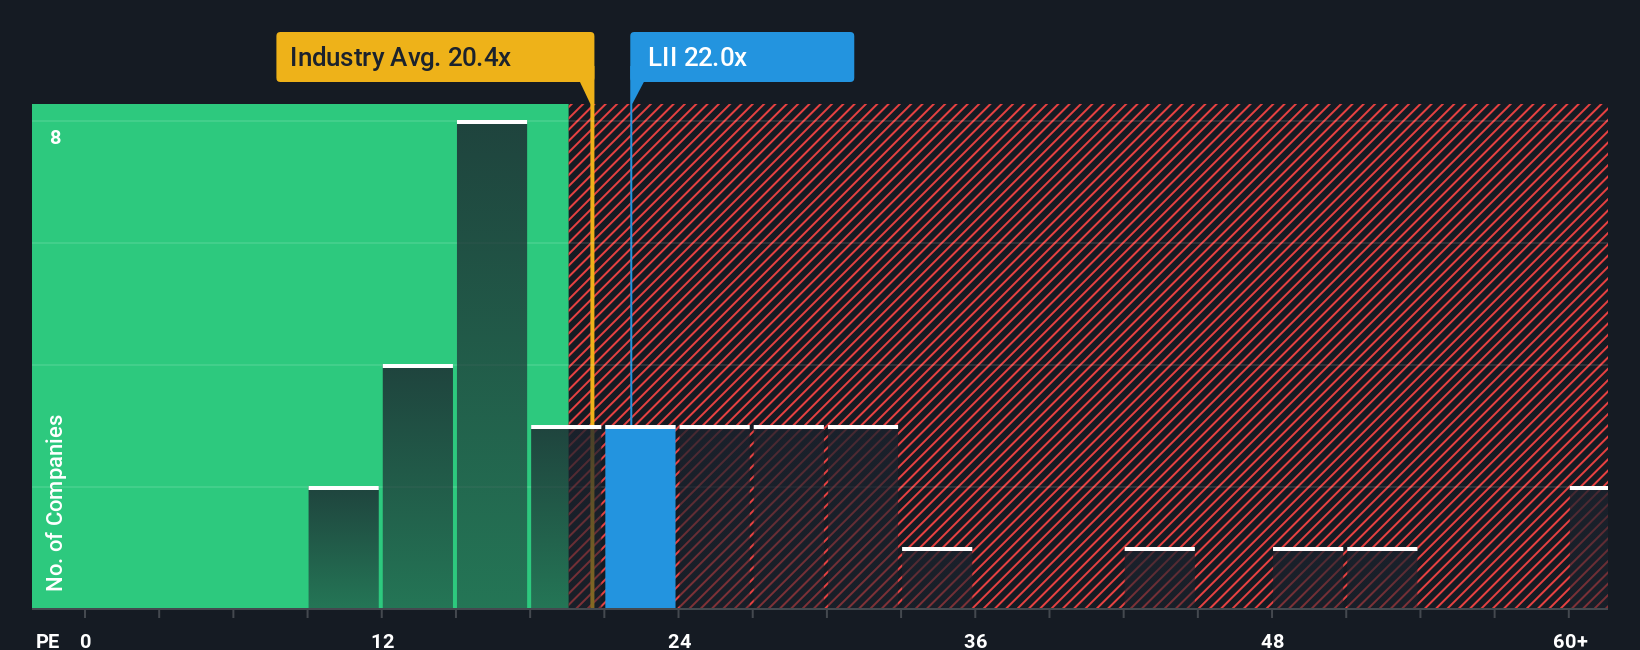
Another View: What Do The P/E Ratios Say?
On the one hand, the narrative fair value suggests Lennox International is about 9% undervalued. On the other, the current P/E of 21.7x sits above both the US Building industry at 19.8x and the peer average at 20.5x, and only slightly below a fair ratio of 23.7x. This raises the question of whether the stock is trading at a genuine discount or simply at a full price for quality.
See what the numbers say about this price — find out in our valuation breakdown.
Build Your Own Lennox International Narrative
If you look at the numbers and reach a different conclusion, that is the point. You can stress test the assumptions, tweak the inputs, and Do it your way in just a few minutes.
A great starting point for your Lennox International research is our analysis highlighting 2 key rewards and 1 important warning sign that could impact your investment decision.
Looking for more investment ideas?
If Lennox got you thinking, do not stop here. Use the same data driven tools to spot other opportunities that match your style and risk tolerance.
- Tap into value by scanning these 876 undervalued stocks based on cash flows that might be trading at prices which do not fully reflect their underlying cash flows.
- Ride powerful tech trends by checking out these 26 AI penny stocks that link artificial intelligence themes with potential long term growth stories.
- Target income potential by reviewing these 11 dividend stocks with yields > 3% that could help you build a portfolio with more reliable cash returns.
This article by Simply Wall St is general in nature. We provide commentary based on historical data and analyst forecasts only using an unbiased methodology and our articles are not intended to be financial advice. It does not constitute a recommendation to buy or sell any stock, and does not take account of your objectives, or your financial situation. We aim to bring you long-term focused analysis driven by fundamental data. Note that our analysis may not factor in the latest price-sensitive company announcements or qualitative material. Simply Wall St has no position in any stocks mentioned.
Have feedback on this article? Concerned about the content? Get in touch with us directly. Alternatively, email editorial-team@simplywallst.com