
Assessing BYD (SEHK:1211) Valuation As It Overtakes Tesla In Battery Electric Vehicle Sales
BYD (SEHK:1211) has just reported unaudited December 2025 production and sales figures, alongside confirmation that it surpassed Tesla as the largest seller of battery electric vehicles, putting fresh attention on how these volumes translate into margins.
See our latest analysis for BYD.
The latest operating data and EV leadership headlines come against a weaker share price backdrop, with a 90 day share price return decline of 12.52% and a 1 year total shareholder return of 12.23%. This suggests that long term holders have still seen gains even as near term momentum has cooled.
If BYD’s move into global markets has caught your attention, it may be worth seeing how other auto makers are priced and growing through auto manufacturers.
So with BYD’s shares cooling recently despite its EV volume lead and a value score of 1 plus an indicated intrinsic discount, are you looking at a genuine mispricing here, or is the market already banking on future growth?
Price to Earnings of 20.2x: Is it justified?
BYD closed at HK$94.65 with our data indicating a P/E of 20.2x, which screens as expensive compared with both peers and an estimated fair level.
The P/E ratio compares the share price to earnings per share, so a higher P/E usually means the market is paying more for each unit of earnings. For a large auto and batteries group like BYD, that often reflects what investors think about future earnings growth and the durability of those profits.
In BYD’s case, statements flag that the current P/E of 20.2x is higher than the peer average of 8.8x and also above an estimated fair P/E of 14x. That reflects a market valuation that is richer than both the wider Hong Kong market and the auto peer group, and the fair ratio indicates a level that valuations could move toward if expectations cool or earnings catch up.
Compared with the Asian auto industry average P/E of 19x, BYD still trades at a premium, which indicates that the market assigns it a higher earnings multiple than many regional competitors.
Explore the SWS fair ratio for BYD
Result: Price-to-Earnings of 20.2x (OVERVALUED)
However, the current premium P/E and recent 90 day share price decline of 12.52% leave the story exposed if earnings growth or EV leadership expectations disappoint.
Find out about the key risks to this BYD narrative.
Another View: DCF Points to Value Support
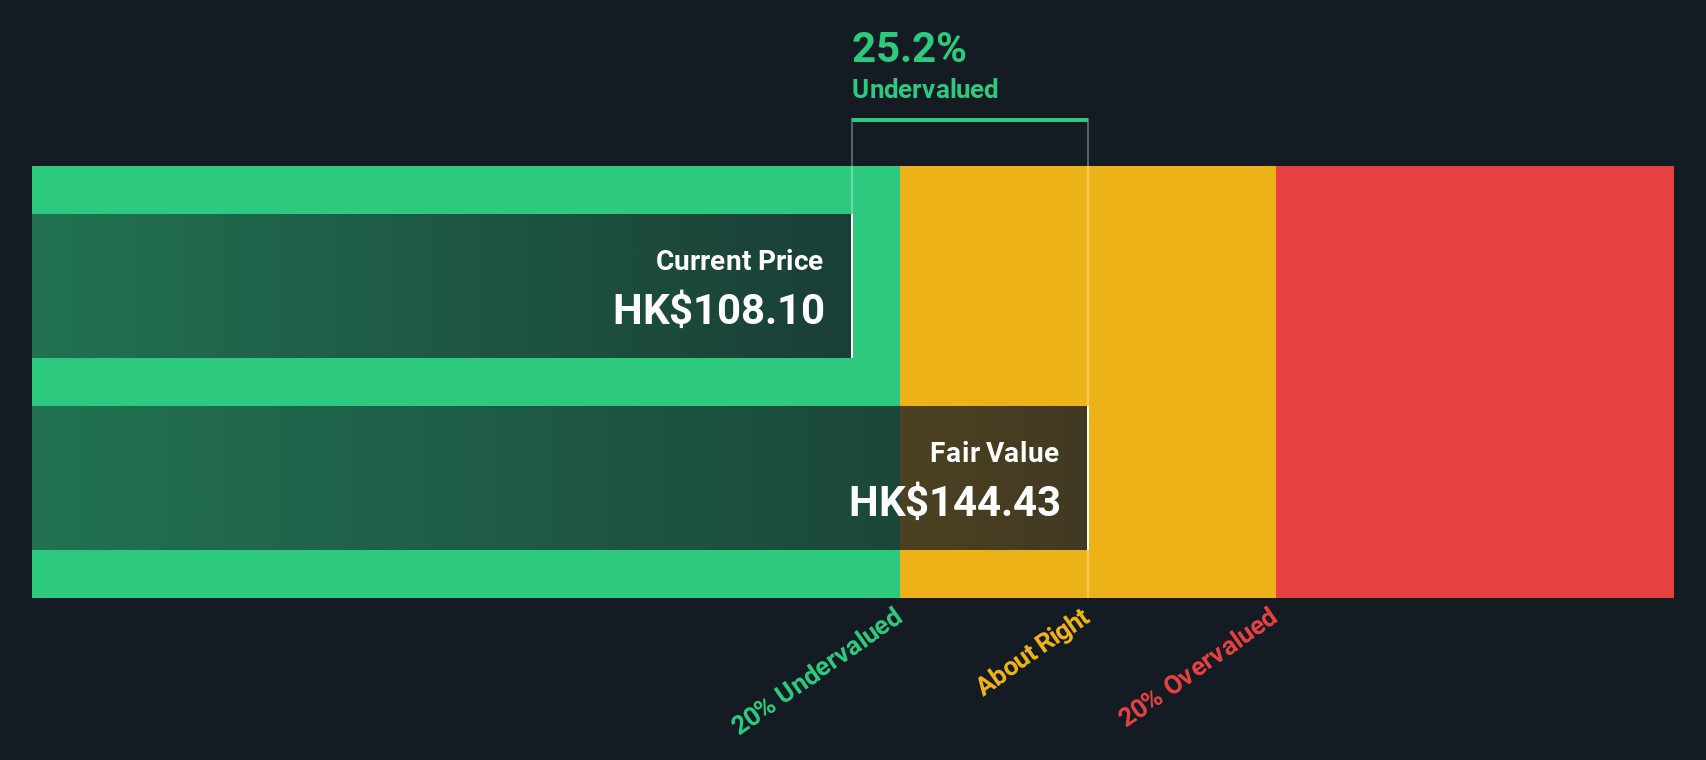
While the 20.2x P/E screens as expensive, our DCF model suggests something different, with BYD at HK$94.65 trading around 17.7% below an estimated fair value of HK$115.07. That implies the share price may already reflect some caution. Is sentiment now too pessimistic?
Look into how the SWS DCF model arrives at its fair value.
Simply Wall St performs a discounted cash flow (DCF) on every stock in the world every day (check out BYD for example). We show the entire calculation in full. You can track the result in your watchlist or portfolio and be alerted when this changes, or use our stock screener to discover 884 undervalued stocks based on their cash flows. If you save a screener we even alert you when new companies match - so you never miss a potential opportunity.
Build Your Own BYD Narrative
If you see the numbers differently or prefer to test your own assumptions, you can build a full BYD narrative yourself in just a few minutes, starting with Do it your way.
A great starting point for your BYD research is our analysis highlighting 3 key rewards and 1 important warning sign that could impact your investment decision.
Looking for more investment ideas?
If you stop with BYD, you could miss other opportunities that fit your style. Use the screeners below to spot ideas that match your next move.
- Target income potential with these 12 dividend stocks with yields > 3% that may suit investors who want regular cash returns from established businesses.
- Chase growth stories by reviewing these 26 AI penny stocks where companies are working with artificial intelligence across different sectors.
- Hunt for potential bargains using these 884 undervalued stocks based on cash flows that focus on companies priced below their estimated cash flow value.
This article by Simply Wall St is general in nature. We provide commentary based on historical data and analyst forecasts only using an unbiased methodology and our articles are not intended to be financial advice. It does not constitute a recommendation to buy or sell any stock, and does not take account of your objectives, or your financial situation. We aim to bring you long-term focused analysis driven by fundamental data. Note that our analysis may not factor in the latest price-sensitive company announcements or qualitative material. Simply Wall St has no position in any stocks mentioned.
Have feedback on this article? Concerned about the content? Get in touch with us directly. Alternatively, email editorial-team@simplywallst.com