
Is Klarna Group (KLAR) Pricing Reflect Recent BNPL Scrutiny And Share Price Pullback
- If you are wondering whether Klarna Group is attractively priced right now, it helps to step back and look at how its current share price lines up with different valuation checks.
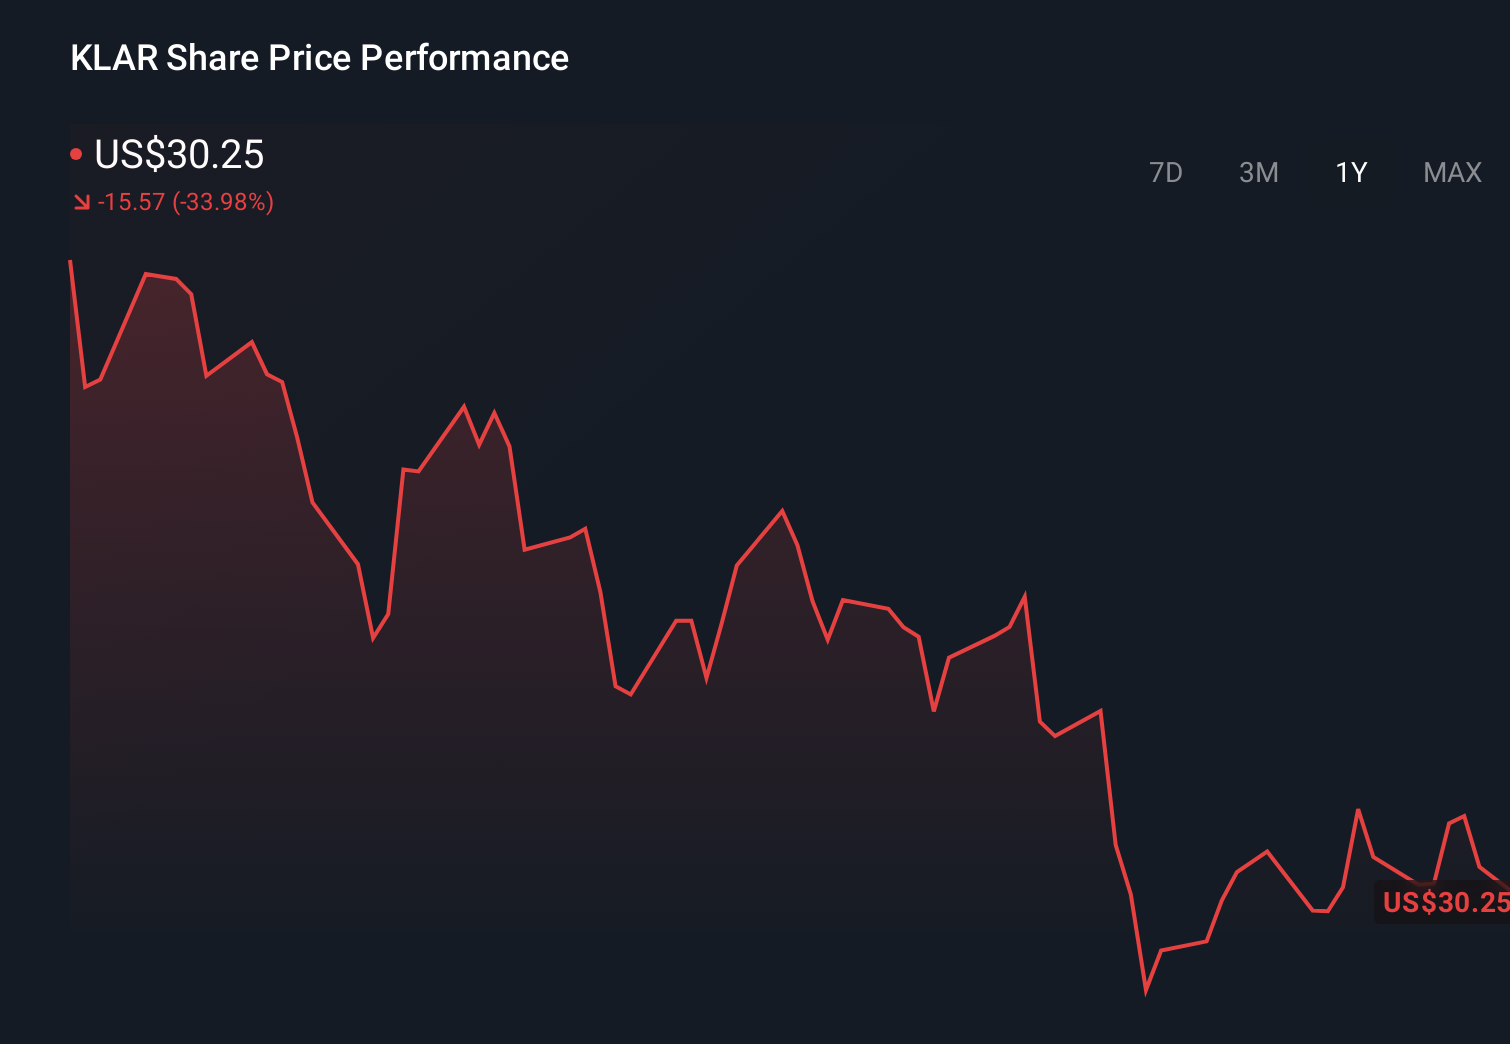
- The stock last closed at US$29.00, with a 7 day return of a 7.8% decline, a 30 day return of a 1.5% decline, and a 1.5% gain year to date, which may have caught the eye of investors thinking about shifting risk and return.
- Recent news around Klarna Group has focused on its position in the buy now, pay later space and on how regulators and merchants are responding to that business model. This backdrop helps explain why the market has been reassessing what it is willing to pay for the stock over the past few weeks.
- The company currently scores 2 out of 6 on our valuation checks. This sets up a closer look at how traditional methods like multiples and cash flow models stack up, and why there might be an even better way to think about value by the end of this article.
Klarna Group scores just 2/6 on our valuation checks. See what other red flags we found in the full valuation breakdown.
Approach 1: Klarna Group Excess Returns Analysis
The Excess Returns model looks at how much profit a company can generate over and above the return that shareholders require, then adds that stream of “excess” value to the current book value per share.
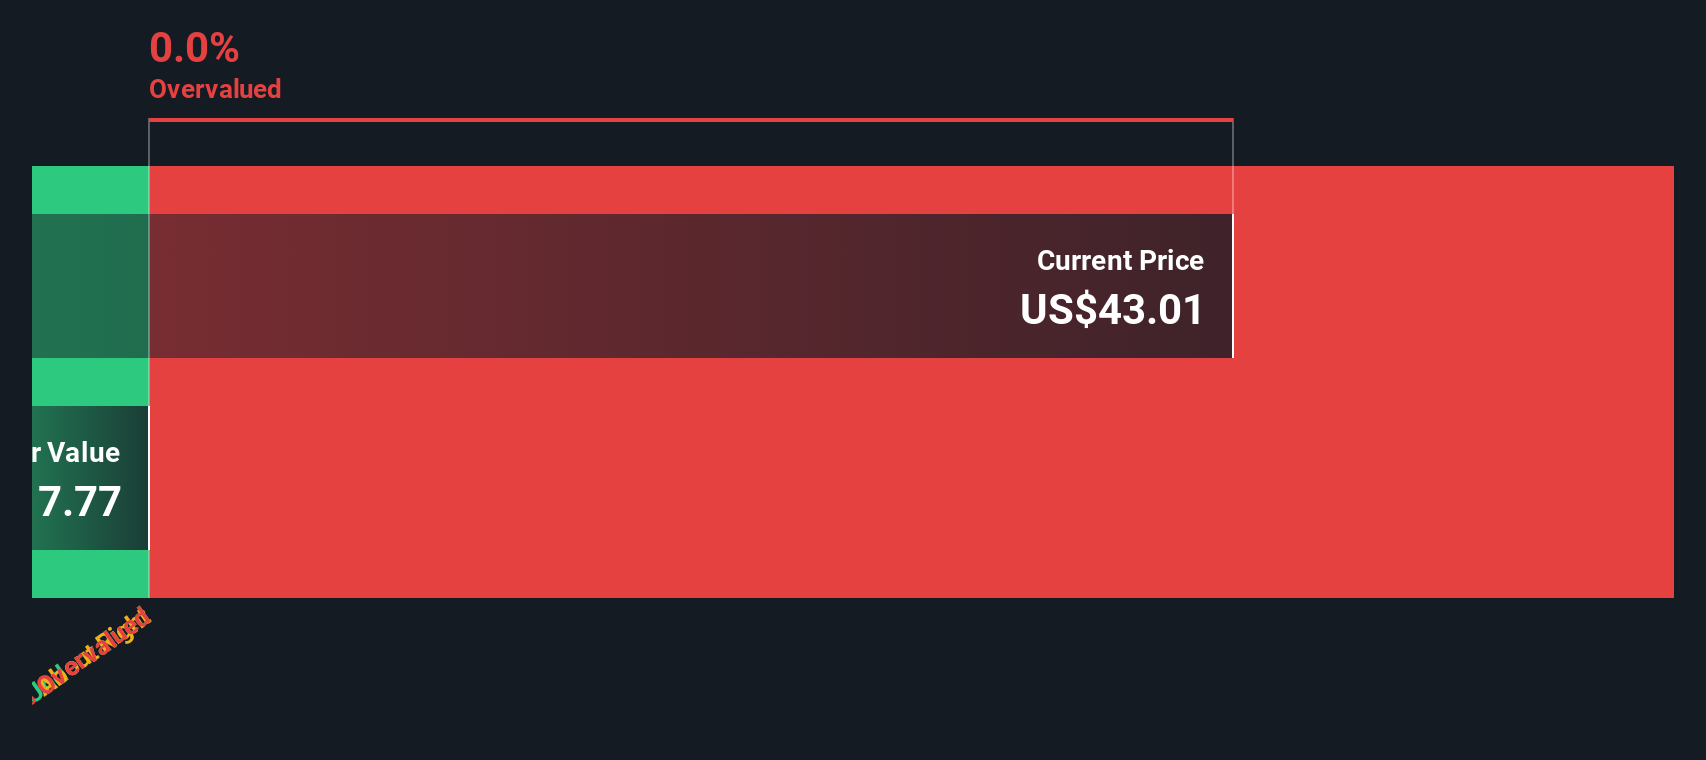
For Klarna Group, the starting point is a Book Value of US$6.49 per share and a Stable EPS estimate of US$1.06 per share, based on weighted future Return on Equity estimates from 8 analysts. The model applies a Cost of Equity of US$0.73 per share, which leaves an Excess Return of US$0.33 per share. That excess is tied to an Average Return on Equity of 12.05% and a Stable Book Value of US$8.77 per share, sourced from weighted future Book Value estimates from 5 analysts.
Simply Wall St converts these inputs into an intrinsic value of about US$15.26 per share using its Excess Returns framework. Compared with the recent share price of US$29.00, this implies Klarna Group is around 90.0% overvalued on this particular model.
Result: OVERVALUED
Our Excess Returns analysis suggests Klarna Group may be overvalued by 90.0%. Discover 871 undervalued stocks or create your own screener to find better value opportunities.
Approach 2: Klarna Group Price vs Sales
For a business where earnings are less useful because of accounting noise or recent losses, the P/S ratio can be a practical way to think about value. It anchors the price to the revenue the company is actually bringing in.
What investors usually pay on a P/S basis tends to reflect how they see growth potential and risk. Higher expected growth or lower perceived risk often lines up with a higher “normal” multiple, and the reverse also tends to be true.
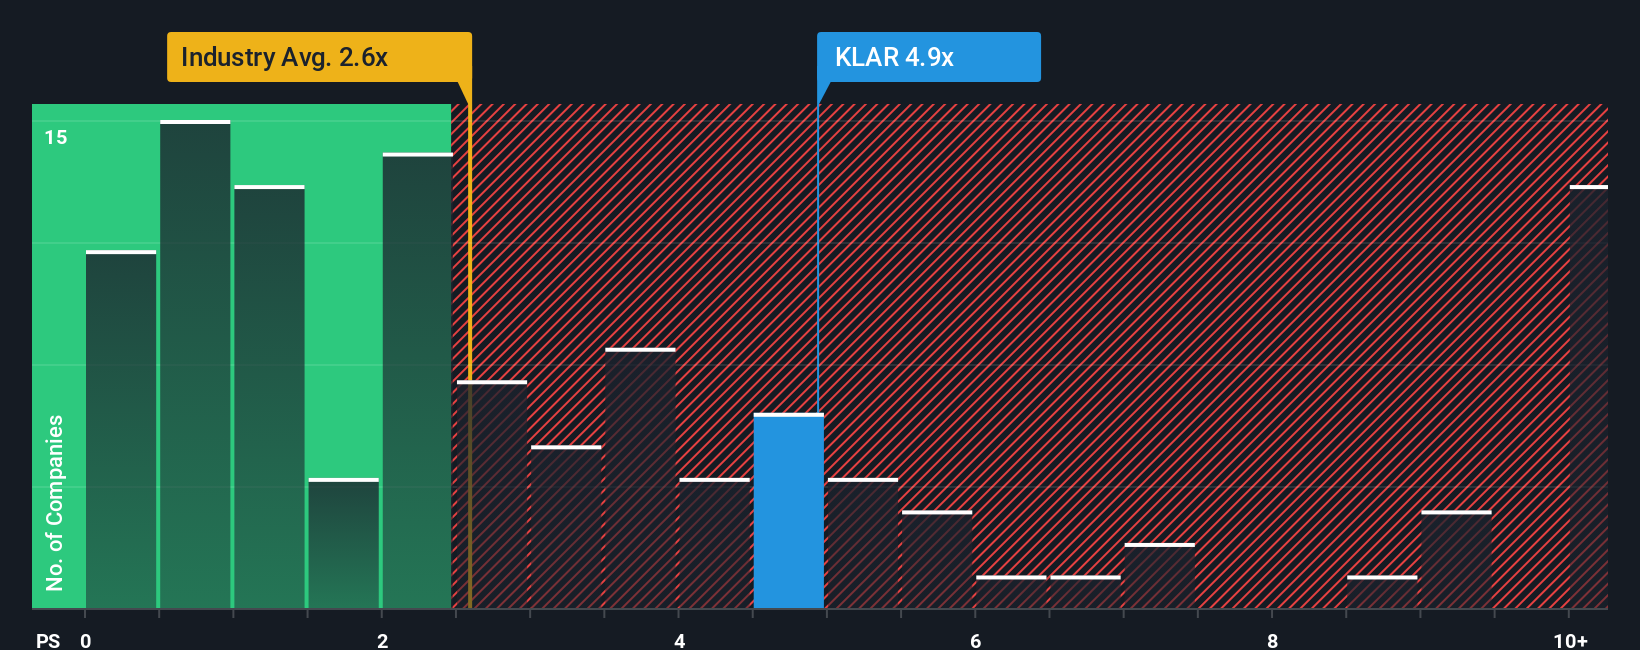
Klarna Group currently trades on a P/S ratio of 3.41x. That sits above the Diversified Financial industry average of 2.71x and below the peer group average of 3.73x. Simply Wall St also uses a proprietary “Fair Ratio” for P/S, which is the multiple it would expect for Klarna Group after accounting for factors like earnings growth, margins, market cap, industry and stock specific risks.
This Fair Ratio can be more informative than a simple peer or industry comparison because it adjusts for the company’s own profile instead of assuming that all Diversified Financial stocks should trade at roughly the same level.
In this case, the Fair Ratio for Klarna Group is not available, so it is not possible to say whether the current 3.41x P/S suggests the shares are overvalued, undervalued or about right based on this model.
Result: ABOUT RIGHT
P/S ratios tell one story, but what if the real opportunity lies elsewhere? Discover 1442 companies where insiders are betting big on explosive growth.
Upgrade Your Decision Making: Choose your Klarna Group Narrative
Earlier we mentioned that there is an even better way to understand valuation, so let us introduce you to Narratives, which are simply your story about a company linked directly to the numbers you think are fair for its future revenue, earnings and margins.
On Simply Wall St, Narratives let you set a view on Klarna Group, connect that story to a financial forecast, and then see the fair value that falls out of those assumptions in an easy to read format on the Community page used by millions of investors.
Once you have a Narrative, the platform lines up your fair value against the current share price, so you can quickly see whether your story suggests the stock might be attractively priced or expensive, and that view automatically refreshes when new data like earnings or news is added.
For example, one Klarna Group Narrative might point to a fair value comfortably below US$29.00 while another might point to a value well above that level, reflecting how two investors can look at the same company and reach very different conclusions based on their assumptions.
Do you think there's more to the story for Klarna Group? Head over to our Community to see what others are saying!
This article by Simply Wall St is general in nature. We provide commentary based on historical data and analyst forecasts only using an unbiased methodology and our articles are not intended to be financial advice. It does not constitute a recommendation to buy or sell any stock, and does not take account of your objectives, or your financial situation. We aim to bring you long-term focused analysis driven by fundamental data. Note that our analysis may not factor in the latest price-sensitive company announcements or qualitative material. Simply Wall St has no position in any stocks mentioned.
Have feedback on this article? Concerned about the content? Get in touch with us directly. Alternatively, email editorial-team@simplywallst.com