
Globus Medical (GMED) Stock After 36% One-Year Gain Is There Still Upside?
- Wondering whether Globus Medical at around US$80.39 still offers value or if the easy money has already been made? This article breaks down what the current price might be implying about the stock.
- Globus Medical has returned 0.5% over the past week and 4.9% over the past month, while year to date the stock is down 7.9% and up 36.5% over the past year.
- Recent coverage has focused on how Globus Medical fits into broader interest in medical technology and healthcare equipment, as investors reassess growth potential and risk across the sector. This backdrop helps explain why the stock's returns over different periods may look mixed, with some investors focusing on long term potential and others on shorter term volatility.
- On Simply Wall St's valuation checks, Globus Medical records a value score of 6 out of 6. This raises an important question about how different valuation methods compare, and whether there might be an even better way to think about value that will be covered at the end of this article.
Approach 1: Globus Medical Discounted Cash Flow (DCF) Analysis
A Discounted Cash Flow, or DCF, model estimates what a stock could be worth today by projecting future cash flows and then discounting those back to a single present value figure. It is essentially asking what all those future dollars are worth in today's terms.
For Globus Medical, the model used is a 2 Stage Free Cash Flow to Equity approach. The latest twelve month free cash flow is about $620.8 million. Analyst projections and Simply Wall St extrapolations suggest free cash flow reaching $1,213.8 million in 2035, with intermediate years such as 2026 at $449.4 million and 2028 at $785.6 million. All of these figures are in $ and reflect cash the company could generate for equity holders.
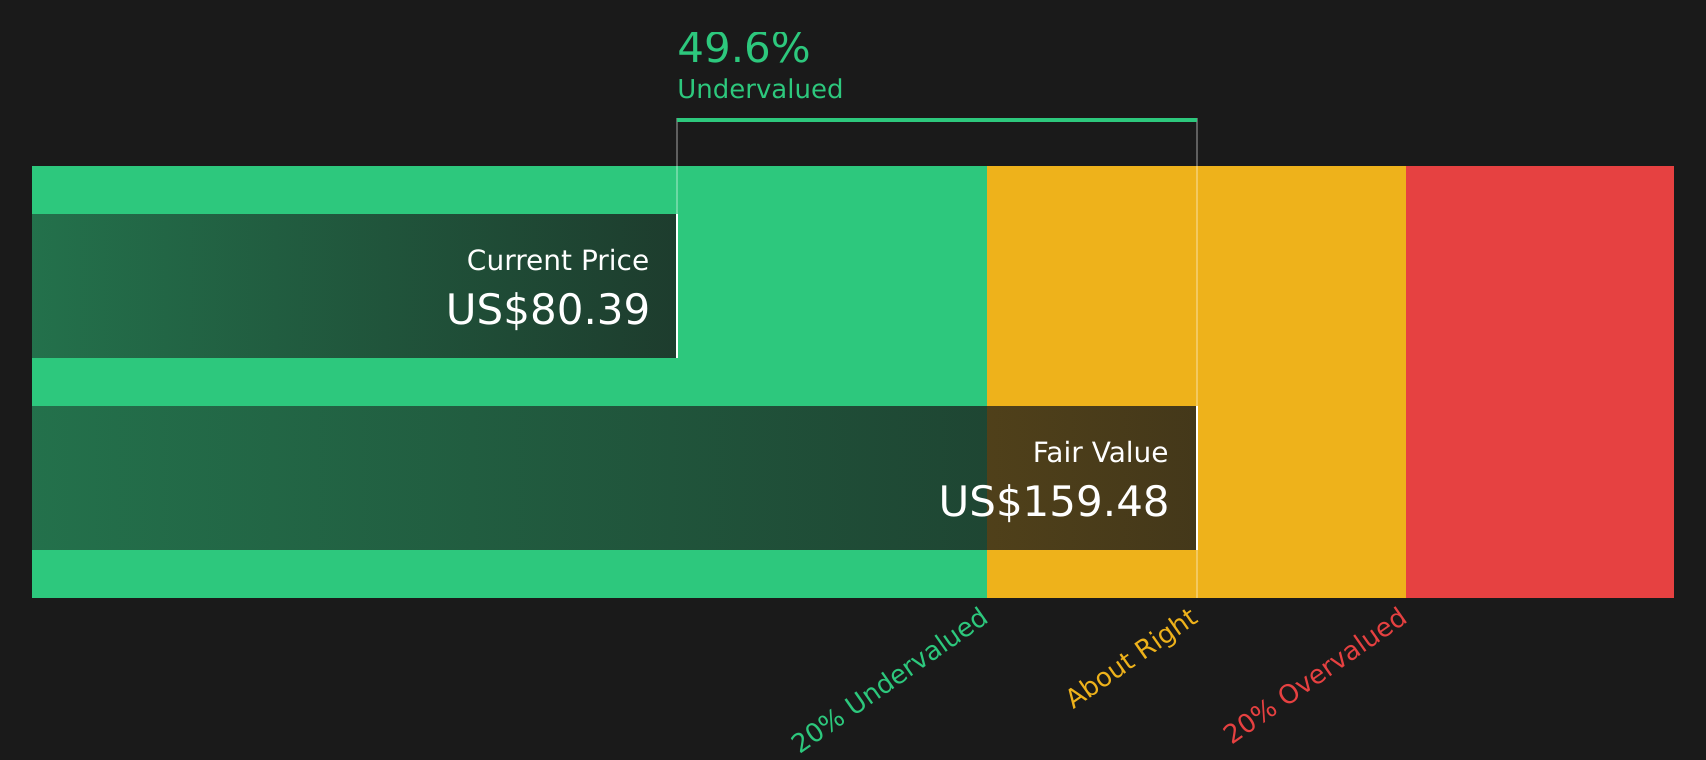
Bringing those projected cash flows back to today, the DCF model arrives at an estimated intrinsic value of $159.48 per share for Globus Medical, compared with a current share price around $80.39. On this basis, the stock screens as about 49.6% undervalued under the stated assumptions.
Result: UNDERVALUED
Our Discounted Cash Flow (DCF) analysis suggests Globus Medical is undervalued by 49.6%. Track this in your watchlist or portfolio, or discover 44 more high quality undervalued stocks.
Approach 2: Globus Medical Price vs Earnings
For profitable companies, the P/E ratio is a useful way to think about value because it links what you pay per share to the earnings the company is already generating. It gives a quick sense of how many dollars investors are currently willing to pay for each dollar of earnings.
What counts as a “normal” or “fair” P/E usually reflects how the market views a company’s growth prospects and risk. Higher expected growth and lower perceived risk often justify a higher multiple, while slower growth or higher risk tend to warrant a lower one.
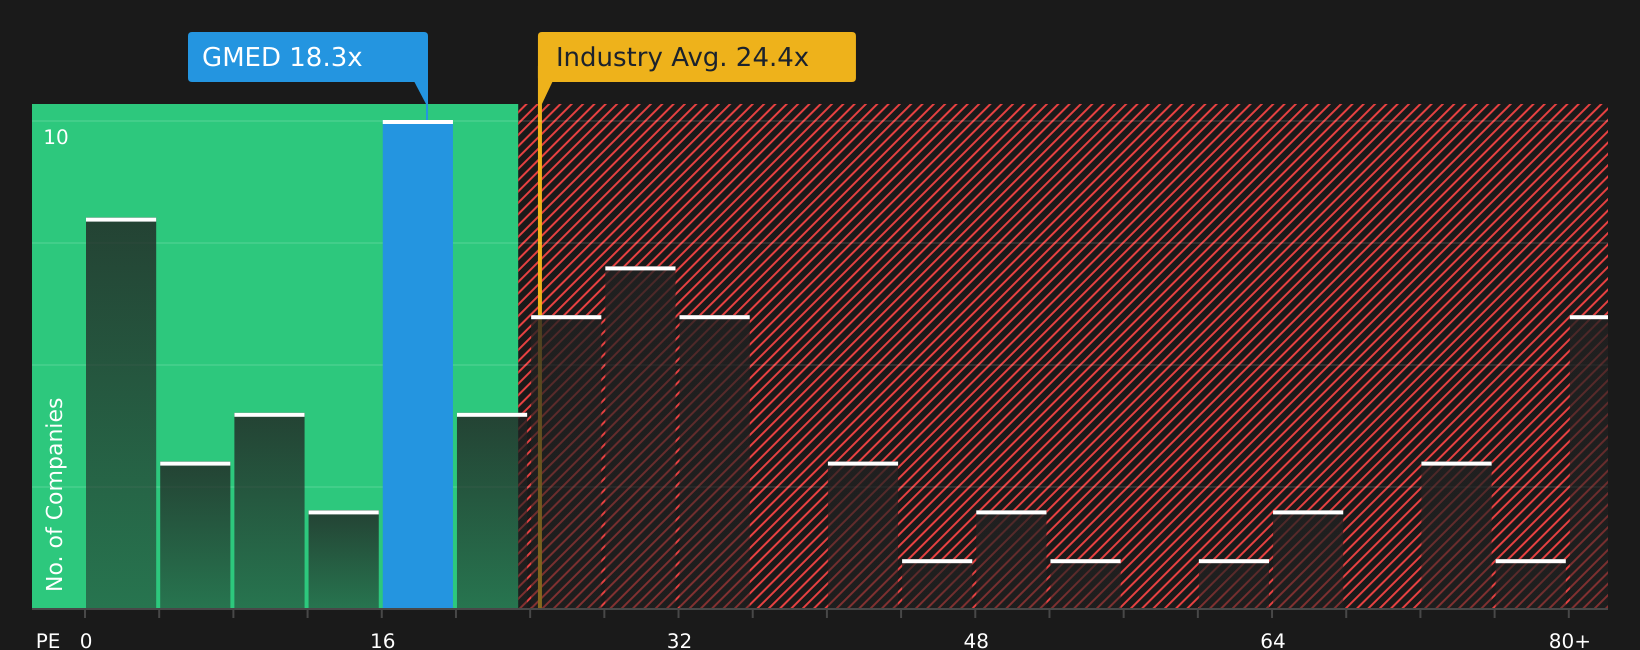
Globus Medical currently trades on a P/E of 18.6x. That sits below the Medical Equipment industry average of 24.5x and also below the peer group average of 43.4x. Simply Wall St’s Fair Ratio for Globus Medical is 23.7x, which is a proprietary estimate of what the P/E might be given factors such as earnings growth, profit margins, industry, market cap and company specific risks.
Because the Fair Ratio incorporates these fundamentals rather than just comparing with broad averages, it can be a more tailored reference point. With the current P/E of 18.6x sitting below the Fair Ratio of 23.7x, the stock screens as undervalued on this multiple based view.
Result: UNDERVALUED
P/E ratios tell one story, but what if the real opportunity lies elsewhere? Start investing in legacies, not executives. Discover our 20 top founder-led companies.
Upgrade Your Decision Making: Choose your Globus Medical Narrative
Earlier it was mentioned that there is an even better way to understand valuation. Narratives on Simply Wall St let you attach your own story about Globus Medical to the numbers by linking your view on its robotics shift, international expansion, acquisitions and margins to a forecast for revenue, earnings and profit margins, which then flows through to a Fair Value that you can compare with the current price.
On the Community page, you can pick or create a Narrative that matches your view, whether that is closer to a bullish Fair Value around US$123.00, a more cautious Fair Value around US$65.00, or the analyst consensus Fair Value near US$110.00. You can then see in one place whether your chosen Fair Value suggests the stock looks cheap or expensive relative to the live market price.
Because Narratives refresh when new results, guidance or news are added, your chosen Globus Medical story and Fair Value stay aligned with the latest information. This can help you decide if and when a gap between Fair Value and price is wide enough to consider buying, holding or selling based on your own assumptions rather than relying only on headline multiples.
Do you think there's more to the story for Globus Medical? Head over to our Community to see what others are saying!

This article by Simply Wall St is general in nature. We provide commentary based on historical data and analyst forecasts only using an unbiased methodology and our articles are not intended to be financial advice. It does not constitute a recommendation to buy or sell any stock, and does not take account of your objectives, or your financial situation. We aim to bring you long-term focused analysis driven by fundamental data. Note that our analysis may not factor in the latest price-sensitive company announcements or qualitative material. Simply Wall St has no position in any stocks mentioned.
Have feedback on this article? Concerned about the content? Get in touch with us directly. Alternatively, email editorial-team@simplywallst.com