
Is Tompkins Financial (TMP) Fairly Valued On Its Russell 2000 Index Exit?
Tompkins Financial (TMP) was recently removed from the Russell 2000 Dynamic Index. This event can shift trading flows as index-tracking funds rebalance, prompting investors to reassess how the stock fits within diversified portfolios.
See our latest analysis for Tompkins Financial.
Against this index removal backdrop, Tompkins Financial’s 1-day share price return of 0.93% sits within a broader pattern of a 2.75% share price gain over 30 days and 9.06% over 90 days, while the 1-year total shareholder return of 40.86% and 3-year total shareholder return of 82.40% point to momentum that has built over time despite some shorter term share price softness.
If this kind of index reshuffle has you rethinking where opportunities might sit next, it could be a good moment to scan for ideas using the 18 top founder-led companies
For Tompkins Financial, the recent index exit and the share price move sit at the crossroads of business fundamentals and shifting sentiment, so how does the current valuation line up with what the underlying bank is actually delivering?
Price-to-Earnings of 7.9x: Is it justified?
On a simple earnings lens, Tompkins Financial trades on a P/E of 7.9x, which sits close to its estimated fair P/E of 7.7x and slightly above the SWS DCF value of $89.37 versus the last close of $91.94.
The P/E ratio compares the current share price to earnings per share. It effectively shows how many dollars investors are paying for each dollar of Tompkins Financial’s earnings, a useful yardstick for banks where profitability and capital efficiency matter.
For Tompkins Financial, a 7.9x multiple comes alongside earnings growth of 127.4% over the past year, higher net profit margins at 38% versus 24.8% a year earlier, and a return on equity of 17.7% that the model still flags as low. This suggests the market may be weighing the strong recent earnings against softer longer term growth signals and forecast declines in both earnings and revenue over the next three years.
Compared with the US Banks industry average P/E of 12x, the stock’s 7.9x level is clearly lower, and it also sits well below a peer average P/E of 15.4x. Yet the fair P/E estimate of 7.7x implies only a modest premium to what regression based modelling points to as a level the multiple could move toward if sentiment and fundamentals stay aligned.
Explore the SWS fair ratio for Tompkins Financial
Result: Price-to-Earnings of 7.9x (ABOUT RIGHT)
However, Tompkins Financial’s annual revenue and net income both declined, and any further weakness in these earnings lines could quickly challenge the current valuation narrative.
Find out about the key risks to this Tompkins Financial narrative.
Another view on Tompkins Financial’s value
While the P/E of 7.9x suggests Tompkins Financial is roughly in line with its fair ratio of 7.7x, our DCF model points to a fair value of $89.37 versus the current $91.94. On that lens, the stock screens slightly expensive, which raises the question of how much margin of safety you really have here.
For a closer look at how this model works in practice, it is worth reviewing the Look into how the SWS DCF model arrives at its fair value.
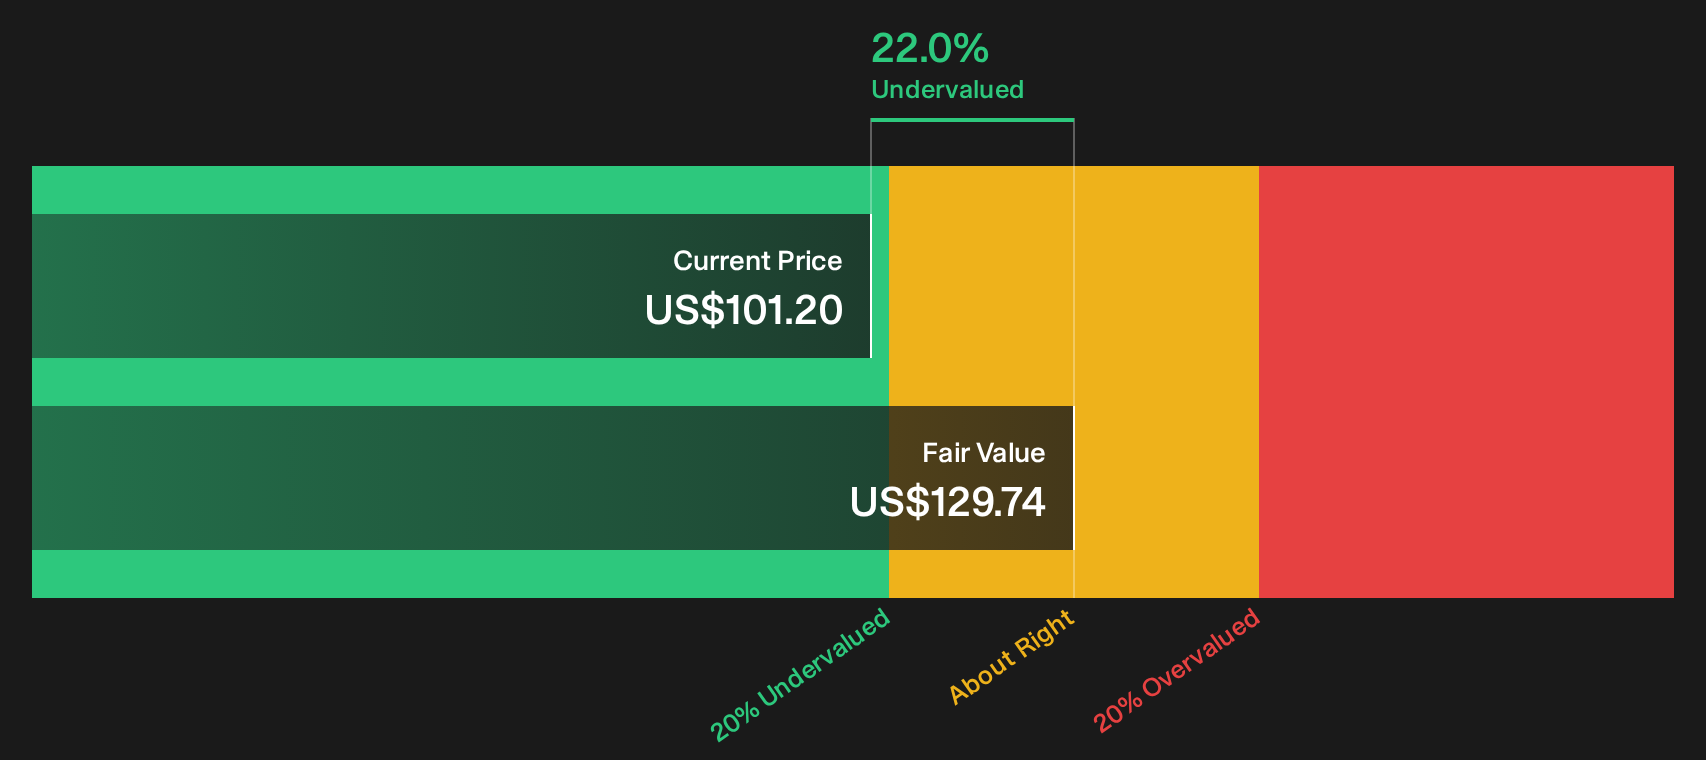
Simply Wall St performs a discounted cash flow (DCF) on every stock in the world every day (check out Tompkins Financial for example). We show the entire calculation in full. You can track the result in your watchlist or portfolio and be alerted when this changes, or use our stock screener to discover 44 high quality undervalued stocks. If you save a screener we even alert you when new companies match - so you never miss a potential opportunity.
Next Steps
If the mixed signals around Tompkins Financial have raised questions for you, this is the moment to move fast, check the data, and weigh both sides. To see how that balance of concerns and potential upsides currently stacks up, review the 3 key rewards and 1 important warning sign
Looking for more investment ideas beyond Tompkins Financial?
Do not stop with Tompkins Financial. Broaden your watchlist with fresh ideas that line up with your goals, risk comfort, and income needs using targeted stock screeners.
- Target resilient returns by focusing on companies that show steadier risk profiles using the 73 resilient stocks with low risk scores.
- Zero in on long term compounding potential by scanning for quality companies trading below their estimated value with the 44 high quality undervalued stocks.
- Build dependable income streams by filtering for companies with stronger yields and staying power through the 9 dividend fortresses.
This article by Simply Wall St is general in nature. We provide commentary based on historical data and analyst forecasts only using an unbiased methodology and our articles are not intended to be financial advice. It does not constitute a recommendation to buy or sell any stock, and does not take account of your objectives, or your financial situation. We aim to bring you long-term focused analysis driven by fundamental data. Note that our analysis may not factor in the latest price-sensitive company announcements or qualitative material. Simply Wall St has no position in any stocks mentioned.
Have feedback on this article? Concerned about the content? Get in touch with us directly. Alternatively, email editorial-team@simplywallst.com