
Be wary of bulls stepping on it! The high level operation of US stocks harbors “dark thunder”: the scale and cost of leveraged bets are booming, and the earnings season limits test the “financing bull market”
The Zhitong Finance App learned that in a context where US stocks are hovering at historic highs and technology stocks and AI concept stocks continue to attract enthusiastic popularity, the US stock financing market is facing increasing tight pressure. According to Morgan Stanley data, on June 26, the cost of financing stock positions once climbed to a level about 200 basis points higher than the federal funds rate, the highest since December 2024. Although the quarterly settlement indicator has fallen back to 89 basis points, market participants warned that the structural factors driving up interest rates have not only not subsided, but have continued to accumulate.
“The risk of a surge in financing is likely to stay with us for the foreseeable future,” said Martin Tobias, an American interest rate strategist at Morgan Stanley. This leverage-driven financing pressure is becoming the most easily overlooked “dark thunder” when US stocks operate at a high level.
“Abnormal jump” in financing costs: demand for leverage far exceeds normal levels
The stock repurchase (repo) market is at the center of this storm. In this market, investors and traders use their shares as collateral to borrow short-term cash. Normally, due to highly liquid collateral, stock financing rates are only a few basis points higher than the federal funds rate or guaranteed overnight financing rate (SOFR).
At the end of June, however, things were quite different. According to Morgan Stanley data, share financing costs rose sharply before the end of the quarter. The root cause of this anomaly is a serious mismatch between supply and demand. Barclays US interest rate strategist Sam Earl attributed the recent pressure to a simple supply and demand problem — demand for equity financing surged while traders' balance sheet capacity failed to keep up. He estimates that the equity financing market is about 10 trillion US dollars, and a 10% increase in leveraged equity exposure could translate into additional financing requirements of about 1 trillion US dollars. Coupled with strong growth in overseas markets (particularly in Asia), these demands are rapidly draining existing financing capacity.
Meanwhile, the equity financing exposure of Tier 1 traders is hovering near historic highs. Even after the quarter-end effect subsided, financing costs remained high — a dynamic that happened at the same time as the stock financing exposure of tier-1 traders hovering at record highs, and lending activity was highly concentrated in a small number of stock groups such as technology and semiconductor companies. As of June 24, data from the Federal Reserve showed that traders held about $211 billion of such exposure on their balance sheets.
According to estimates by Morgan Stanley interest rate strategist Martin Tobias, the ratio of traders' share repurchase exposure to the S&P 500's free circulation market value has risen 50% over the past year — meaning that every dollar of stock capital that can be invested is increasingly dependent on leveraged support.
The Structural Expansion of Leverage: From Margin Debt to Leveraged ETFs
Behind the sharp rise in financing costs is a systematic expansion in the level of leverage on US stocks. Margin debt reached a record high. According to data from the US Financial Industry Regulatory Authority (FINRA), in May 2026, US margin debt reached a record 1.42 trillion US dollars, up 8.5% month-on-month and 53.7% year-on-year. Meanwhile, the net credit balance of US investors fell to a record low of minus 991.7 billion US dollars, measured by the difference between cash in investors' margin accounts and borrowed funds.
Behind this trend is the explosive growth in the size of leveraged ETFs in the US. According to Bloomberg data, the total assets of US leveraged and inversely leveraged stock ETFs are approaching 200 billion US dollars. Among them, up to 85% of leveraged ETF assets are concentrated in the three major sectors of technology, artificial intelligence, and semiconductors. The asset management scale of the triple-multiplied semiconductor ETF (SOXL) has reached a record high of US$34 billion, and has more than tripled since April. The size of the three-fold NASDAQ 100 ETF (TQQQ) also rose to about 40 billion US dollars, close to an all-time high.
The procyclical trading mechanism of leveraged ETFs is amplifying market fluctuations. Macro strategist Simon White points out that leveraged ETFs naturally have a “shorting gamma” attribute — they have to keep buying when they rise and are forced to sell when they fall. On some trading days, the trading demand brought about by rebalancing alone reached more than 50 billion US dollars, a record high. ,
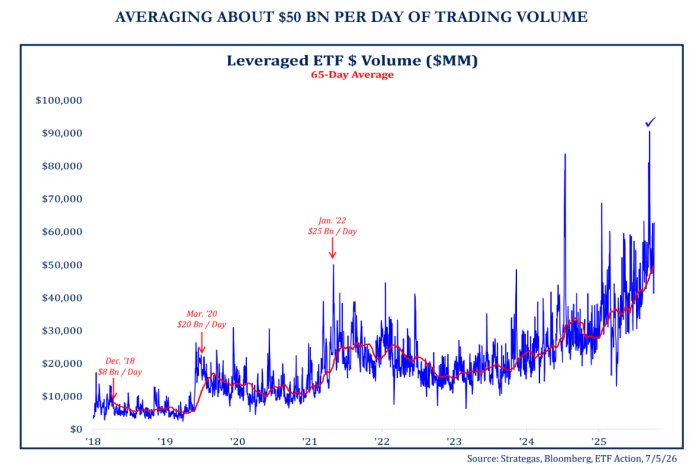
Toronto independent proprietary trader Kevin Muir likened the current environment to an “extremely crowded deal” — optimism is ingrained. “Due to the current frenzied speculation, the next adjustment is likely to be much larger than people expected,” Muir warned.
The explosive growth of leveraged ETFs. In just over two months from March 30 to June 3, the asset size of leveraged ETFs almost doubled to a record $220 billion. Among them, the scale of technology-related leveraged ETFs increased by 136%, and the scale of semiconductor-related leveraged ETFs increased by nearly 175%. These funds amplify their exposure through total revenue swaps (TRS), while banks simultaneously hold cash shares and refinance through the repurchase market, forming a layered and leveraged chain.
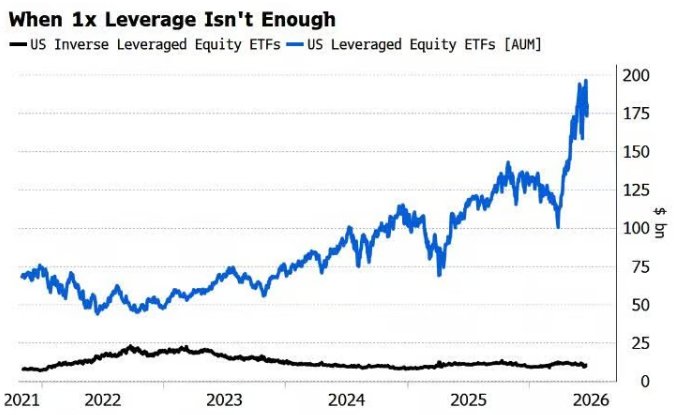
There is more leverage behind every dollar of stock. Tobias measures that the ratio of traders' share repurchase exposure to the S&P 500 free circulation market value has climbed 50% over the past year, indicating that every dollar of investable stock capital is increasingly supported by leverage.
Dealers' balance sheets are “overstretched”: the imbalance between supply and demand in the trillion dollar market
The pressure on the financing market is not an isolated short-term phenomenon; it has revealed the deeper structural weaknesses of the US financial system. The pace of expansion of traders' balance sheets is far short of keeping up with the increase in demand for leverage. Even when highly liquid collateral is used as a guarantee, the cost of financing remains high, indicating that the market makers' ability to accept it is close to the limit. Unless market makers' balance sheets expand drastically, or stock prices cool enough to reduce financing needs, similar pressures may reappear.
This imbalance between supply and demand means that unless market makers' balance sheets expand drastically, or stock prices cool enough to reduce demand for financing, similar pressures may recur.
The Federal Reserve clearly warned in its semi-annual “Financial Stability Report” released in May, and is paying close attention to risk factors such as excessive asset valuation and financial leverage. The report points out that US stock prices are at historically high levels, while stock risk premiums are close to low, which means that investors take higher risks but may not be able to get corresponding returns. The leverage ratio of hedge funds remains high and continues to be concentrated in the largest funds.
The broader shadow banking system is also accumulating risk. The risk exposure of the US banking sector to hedge funds and non-bank financial institutions has increased from about $2 trillion to about $4.5 trillion, and the average total leverage ratio of US hedge funds has nearly doubled since 2022. Goldman Sachs futures trading expert Robert Quinn pointed out in early July that there was an “unprecedented” jump in stock financing costs, and trader leverage hit a mid-year historical peak.
Notably, not all market players are aggressively leveraging. According to Goldman Sachs main broker data, the total leverage ratio of US long and short hedge funds is currently at the 2nd percentile of the past year, and the net leverage ratio is at the 6th percentile — in the past 12 months, hedge funds have hardly been as conservative as they are now. This suggests that the current focus of leveraged expansion is not professional hedge funds, but retail investors, leveraged ETFs, and other non-bank institutions.
Systemic risk: when rising financing costs trigger a ripple effect
Higher financing costs are changing the underlying logic of market operation. For higher “cost of holding” thresholds, leveraged holders need more share price increases to cover financing bills. When banks shrink loans during reporting periods such as the end of the quarter, they can allocate financing by increasing fees or requiring more collateral. This in turn may cause the most leveraged market segments to sell faster when prices fluctuate, concentrating the decline on those stocks that initially attracted leverage.
Market leadership narrows and leverage is concentrated. The leading sector in the stock market is declining, and leverage is increasingly concentrated in popular technology sectors, making the market more vulnerable when sentiment changes.
A potential “amplifier” effect. Macro strategist Simon White warned that the current record level of leverage has extended from retail ETFs and hedge funds to banks and money markets, penetrating deep into the entire system through bank balance sheets. Banks' exposure to hedge funds doubled to about $4.5 trillion in four years, and the feedback cycle will turn banks from “shock absorbers” to “amplifiers” of market fluctuations.
Earl anticipates that unless market makers' balance sheets expand substantially, or stock prices cool enough to reduce demand for financing, similar pressures may recur. Muir's warning is more straightforward: “If this all goes its own way, it will create a very dangerous environment. The possibility of an accident is increasing.”
Outlook: High leverage meets profit verification period, “stress test” of earnings season
Entering mid-July, US stocks are facing a critical macro juncture — the second-quarter earnings season. In the context of high financing costs and crowded leveraged positions, whether corporate profits can support current valuations will become a core variable for testing market resilience. According to FactSet data, analysts raised S&P 500's second-quarter earnings forecast by 3.4% in the second quarter, and the second-quarter profit is expected to increase by 23.3% year-on-year. 111 S&P 500 companies have issued earnings per share guidance for the second quarter, of which 57% gave positive guidance.
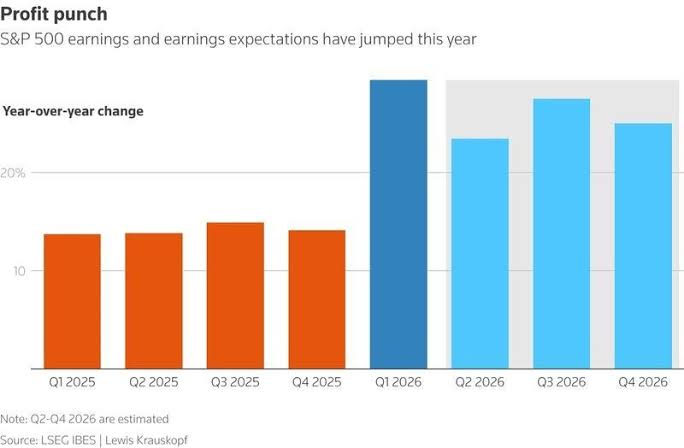
However, the high beta nature of leveraged ETFs means that any earnings report that falls short of expectations may trigger a chain reaction — mechanical rebalancing of leveraged ETFs will amplify the decline. Goldman Sachs strategists have pointed out that higher US bond yields, slower growth, and concerns about the sustainability of AI profits will limit further valuation expansion. Bank of America strategist Savita Subramanian believes that the S&P 500 index faces the risk of a pullback in the second half of the year. The pressure is mainly due to excessive growth expectations and uncertainty about the return on AI infrastructure capital expenditure.
The double test of financing costs and financial reporting. Changes in financing costs, adjustments to leveraged funds, and marginal changes in regulatory attitudes may amplify market fluctuations. The market is currently extremely narrow — semiconductor and computer hardware companies contributed about 87% of the increase in the S&P 500 index in the first half of the year. This means that if the AI leader's performance falls short of expectations, highly concentrated leveraged positions may trigger chain liquidation.
End of quarter effect or comeback: At the end of the upcoming quarter, banks reduce lending to meet financial reporting requirements. Repurchase interest rates usually rise sharply, and rising short-term cash costs may trigger a general decline in popular transactions.
Goldman Sachs's “tactical opportunity” judgment: Goldman Sachs quantitative strategists pointed out that the size of leveraged semiconductor ETFs has plummeted by about 53 billion US dollars from its peak, the hedge fund leverage ratio has fallen to its lowest level in nearly a year, and systemic pressure is being digested. As leverage recedes and the position structure stabilizes, the bank believes that the present is a tactical opportunity to tentatively open positions in semiconductor and momentum stocks.
However, as Muir warned, in a market driven by leverage, the more deeply entrenched the optimism is, the more damaging the final pullback is. At a time when financing costs continue to be high, traders' balance sheets are stretched, and leverage is concentrated in a few popular sectors, the US stock market may be preparing for a far more intense fluctuation than it appears on the surface.
When the cost of borrowing money to buy stocks soared 200 basis points, leveraged ETFs approached $200 billion, and margin debt hit a record record of $1.42 trillion, the rise in US stocks was no longer just a fundamental story. It's becoming more and more like a leverage-driven “financing bull” — behind every dollar's rise, it is supported by more and more borrowed money. The curse of leverage is that it amplifies profits when it rises, and it also amplifies pain when it falls. As earnings season kicks off, this feast built on leverage is about to face a real stress test.