
Sharp (TSE:6753) Launches Karada Mate Watch, Is The Stock Still Trading At A Discount?
Sharp (TSE:6753) is drawing new attention after launching its first health-focused smartwatch, the Karada Mate Watch. The device uses HEALBE’s FLOW technology to automatically estimate calorie intake, hydration, and other physiological metrics.
See our latest analysis for Sharp.
Despite the Karada Mate Watch signalling a new push into digital health wearables, Sharp’s share price return tells a mixed story, with the stock down 18.75% year to date and up 6.9% over 90 days, while the 1 year total shareholder return has declined 1.97%.
If this kind of health tech move has your attention, it may be worth broadening your research using a screener focused on AI related plays such as 10 AI small caps.
So with Sharp pushing into health wearables yet carrying a long record of weaker shareholder returns, do today’s valuation metrics still leave enough upside potential to justify the risks that buyers are taking on?
Price to earnings of 8.8x: Is it justified?
On simple valuation checks, Sharp looks modestly priced, with the stock trading on a P/E of 8.8x at a last close of ¥646.1 and several metrics suggesting a discount to fair value estimates.
The P/E ratio compares the current share price to earnings per share and is a quick way of seeing how much the market is paying for each unit of profit. For a diversified electronics and consumer durables company like Sharp, it is a common yardstick investors use when weighing it against both peers and the wider JP Consumer Durables industry.
According to Simply Wall St’s assessment, Sharp is trading at good value on several fronts. The company is described as trading at good value compared to peers and the broader industry, with its 8.8x P/E sitting below both the JP Consumer Durables industry average of 9.7x and a peer average of 15.3x. In addition, the estimated fair P/E for Sharp is 12.5x, which points to a level the market could move towards if sentiment and fundamentals stay aligned with those fair value assumptions.
That valuation message is reinforced by the SWS DCF model, which estimates a future cash flow value of ¥706.91 per share, compared with the current price of ¥646.1 and a stated 8.6% discount to that intrinsic value. For investors, that combination of a below industry and peer P/E, plus a gap to the DCF fair value, frames Sharp as a stock that the market is pricing more conservatively than those fair value markers imply.
Explore the SWS fair ratio for Sharp
Result: Price-to-earnings of 8.8x (UNDERVALUED)
However, Sharp still faces pressure from declining annual revenue and net income growth, and a long track record of weaker multi year shareholder returns could keep sentiment cautious.
Find out about the key risks to this Sharp narrative.
Another view on Sharp’s valuation
The SWS DCF model offers a second lens on Sharp, putting fair value at ¥706.91 per share versus the current ¥646.1, which implies the stock is trading at an 8.6% discount. If both earnings based and cash flow based views point to value, what might the market be worried about?
Look into how the SWS DCF model arrives at its fair value.
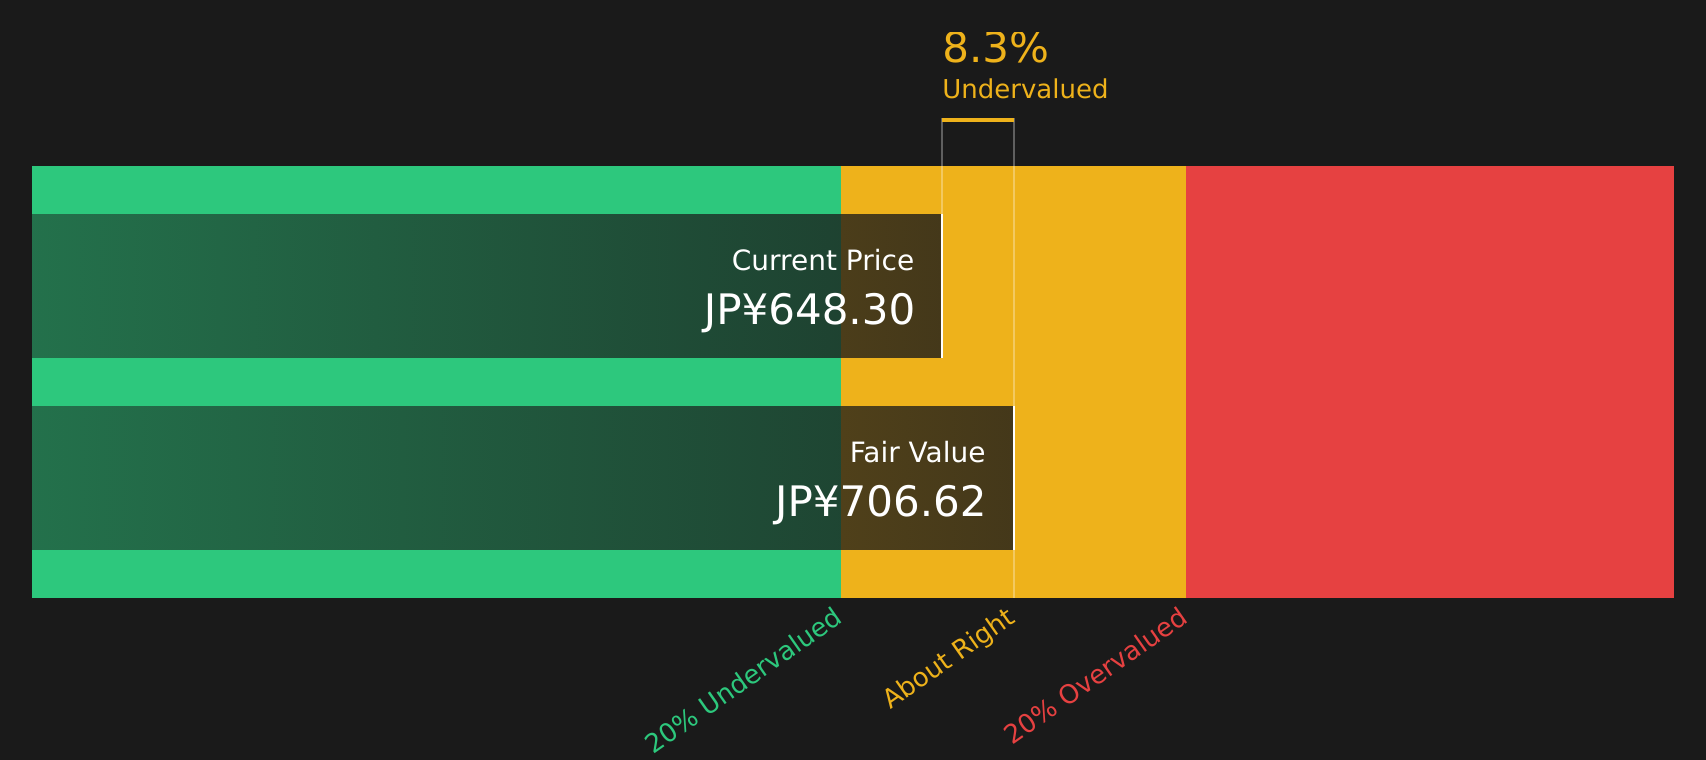
Simply Wall St performs a discounted cash flow (DCF) on every stock in the world every day (check out Sharp for example). We show the entire calculation in full. You can track the result in your watchlist or portfolio and be alerted when this changes, or use our stock screener to discover 20 high quality undervalued stocks. If you save a screener we even alert you when new companies match - so you never miss a potential opportunity.
Next Steps
With mixed signals around Sharp’s outlook, it makes sense to move quickly and review the full picture for yourself, including the 3 key rewards and 3 important warning signs.
Looking for more investment ideas beyond Sharp?
Do not stop at Sharp alone; broaden your watchlist with a few focused ideas that can help you compare different types of opportunities side by side.
- Target potential mispricing by scanning for companies trading below what their fundamentals suggest using the 20 high quality undervalued stocks.
- Strengthen your income focus by checking out stocks that offer robust yields and payout histories through the 43 dividend fortresses.
- Prioritise resilience by reviewing companies with sturdy finances and reliable balance sheets in the solid balance sheet and fundamentals stocks screener (38 results).
This article by Simply Wall St is general in nature. We provide commentary based on historical data and analyst forecasts only using an unbiased methodology and our articles are not intended to be financial advice. It does not constitute a recommendation to buy or sell any stock, and does not take account of your objectives, or your financial situation. We aim to bring you long-term focused analysis driven by fundamental data. Note that our analysis may not factor in the latest price-sensitive company announcements or qualitative material. Simply Wall St has no position in any stocks mentioned.
Have feedback on this article? Concerned about the content? Get in touch with us directly. Alternatively, email editorial-team@simplywallst.com