
Is Fletcher Building (NZSE:FBU) Undervalued As It Raises FY26 Earnings Guidance?
Fletcher Building (NZSE:FBU) raised its earnings guidance for the year to 30 June 2026, flagging higher EBIT from core operations and surplus property sales, while cautioning that macro risks could affect future commercial project activity.
See our latest analysis for Fletcher Building.
The earnings guidance update comes after a period where Fletcher Building’s share price has been rebuilding momentum, with a 7 day share price return of 6.51% and a 90 day return of 20%, even though the year to date share price return is down 4% and the 3 year total shareholder return is down 29.26%.
If this kind of guidance upgrade has you rethinking your watchlist, it could be a good moment to broaden your search using our screener of 105 top founder-led companies
Bulls see Fletcher Building’s guidance lift and recent share price rebound as evidence the stock is mispriced, while bears point to past losses and macro risks. Which side does the current valuation actually support next?
Preferred Price-to-Sales of 0.6x: Is it justified?
Fletcher Building is currently trading at NZ$3.60, and on Simply Wall St’s numbers that equates to a P/S of 0.6x, which screens as good value compared with both its peers and the wider global building sector.
The P/S ratio compares a company’s market value with its annual revenue, so a lower multiple can indicate that investors are paying less for each dollar of sales. For a diversified building products and construction group like Fletcher Building, where earnings are currently in a loss and profit based metrics are less useful, revenue based valuation can be a practical reference point.
In that context, the 0.6x P/S stands well below the global building industry average of 0.9x and the peer average of 2.5x. This indicates that the market is assigning a meaningful discount to Fletcher Building’s NZ$7,008m revenue base. The Simply Wall St fair P/S ratio of 0.9x also sits higher than the current multiple, which indicates that if sentiment shifted closer to that level, the valuation could move materially.
Explore the SWS fair ratio for Fletcher Building
Result: Price-to-sales of 0.6x (UNDERVALUED)
However, Fletcher Building still faces risks from earlier losses and macro driven softness in commercial projects, which could weigh on sentiment if project pipelines slow further.
Find out about the key risks to this Fletcher Building narrative.
Another View: SWS DCF Fair Value Check
While the current P/S of 0.6x makes Fletcher Building look inexpensive against peers, the SWS DCF model goes further and values the stock at NZ$7.26 per share, compared with the current NZ$3.60. That is a large gap, so is the market too cautious or is the model too optimistic?
Look into how the SWS DCF model arrives at its fair value.
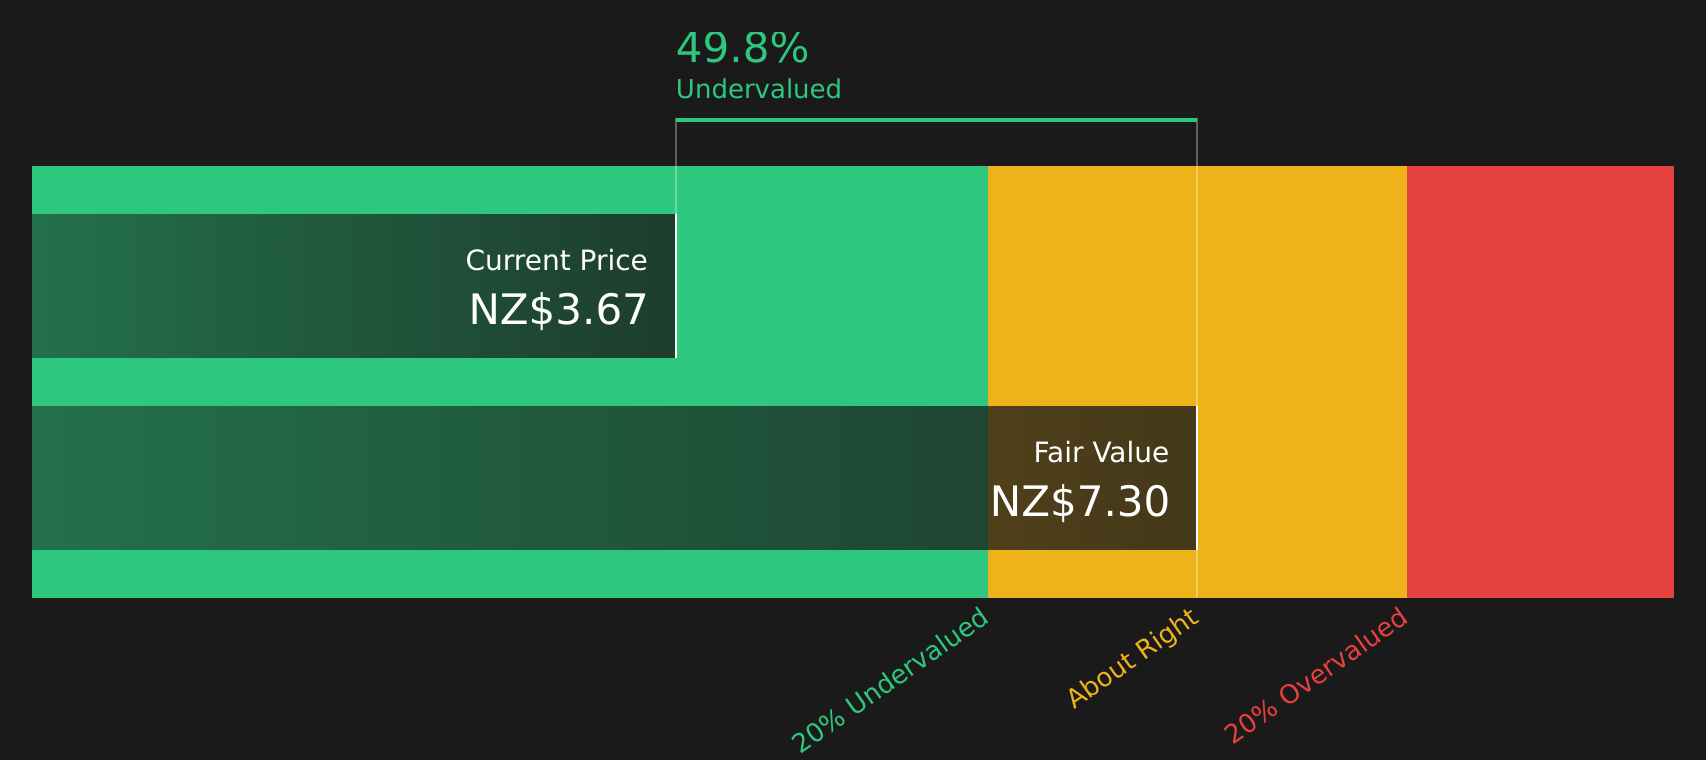
Simply Wall St performs a discounted cash flow (DCF) on every stock in the world every day (check out Fletcher Building for example). We show the entire calculation in full. You can track the result in your watchlist or portfolio and be alerted when this changes, or use our stock screener to discover 212 high quality undervalued stocks. If you save a screener we even alert you when new companies match - so you never miss a potential opportunity.
Next Steps
If the mixed tone of Fletcher Building’s valuation and guidance leaves you on the fence, act while the data is fresh and test your own thesis with the 3 key rewards
Looking for more investment ideas beyond Fletcher Building?
If Fletcher Building has sharpened your investment focus, do not stop here. Broaden your watchlist now so you are not late to the next opportunity.
- Target resilient cash generators with strong foundations by scanning the solid balance sheet and fundamentals stocks screener (419 results) that prioritize financial strength and durability.
- Hunt for potential mispriced opportunities by reviewing the 212 high quality undervalued stocks that combine quality fundamentals with discounted valuations.
- Prioritize steadier return profiles by checking the 300 resilient stocks with low risk scores designed to highlight companies with lower overall risk scores.
This article by Simply Wall St is general in nature. We provide commentary based on historical data and analyst forecasts only using an unbiased methodology and our articles are not intended to be financial advice. It does not constitute a recommendation to buy or sell any stock, and does not take account of your objectives, or your financial situation. We aim to bring you long-term focused analysis driven by fundamental data. Note that our analysis may not factor in the latest price-sensitive company announcements or qualitative material. Simply Wall St has no position in any stocks mentioned.
Have feedback on this article? Concerned about the content? Get in touch with us directly. Alternatively, email editorial-team@simplywallst.com