
European Growth Companies With High Insider Ownership In July 2026
As geopolitical tensions and energy market volatility shape the European financial landscape, investors are closely monitoring how these factors influence inflation and monetary policy expectations. Amidst this backdrop, growth companies with high insider ownership can offer unique insights into potential resilience and strategic alignment with shareholder interests.
Top 10 Growth Companies With High Insider Ownership In Europe
| Name | Insider Ownership | Earnings Growth |
| Kuros Biosciences (SWX:KURN) | 26.1% | 58.4% |
| KebNi (OM:KEBNI B) | 11.8% | 90.9% |
| Hacksaw (OM:HACK) | 13.2% | 24.8% |
| Dellia Group (OB:DELIA) | 29.9% | 47.9% |
| CTT Systems (OM:CTT) | 17.4% | 47.1% |
| Clavister Holding AB (publ.) (OM:CLAV) | 20.7% | 73.9% |
| Circus (XTRA:CA1) | 21.9% | 84.4% |
| CD Projekt (WSE:CDR) | 35.2% | 29.7% |
| Bonesupport Holding (OM:BONEX) | 10.6% | 33.7% |
| Bergen Carbon Solutions (OB:BCS) | 11.9% | 50.2% |
We'll examine a selection from our screener results.
Canatu Oyj (HLSE:CANATU)
Simply Wall St Growth Rating: ★★★★★☆
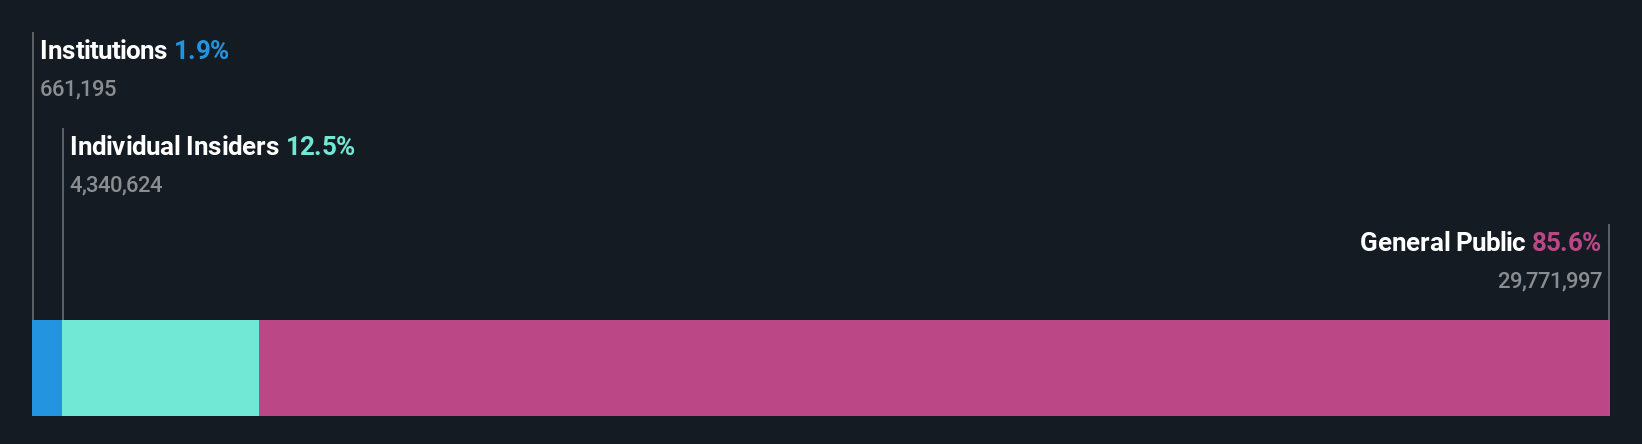
Overview: Canatu Oyj specializes in developing and selling carbon nanotubes and related products, as well as manufacturing equipment for the semiconductor, automotive, and medical diagnostics industries across Finland, the United States, Japan, and Taiwan, with a market cap of €252.11 million.
Operations: The company's revenue is primarily generated from its Semiconductor Equipment and Services segment, which accounts for €16.70 million.
Insider Ownership: 12.6%
Revenue Growth Forecast: 31.5% p.a.
Canatu Oyj is projected to achieve profitability within three years, with revenue growth significantly outpacing the Finnish market at 31.5% annually. Despite a volatile share price recently, analysts agree on a potential 32.8% rise in stock value. The company trades at 57.4% below estimated fair value, suggesting possible undervaluation. Recent executive appointments aim to bolster technological and marketing capabilities, enhancing Canatu's strategic positioning in advanced diagnostics and semiconductor sectors across Europe and beyond.
- Delve into the full analysis future growth report here for a deeper understanding of Canatu Oyj.
- Upon reviewing our latest valuation report, Canatu Oyj's share price might be too pessimistic.
Leonteq (SWX:LEON)
Simply Wall St Growth Rating: ★★★★☆☆
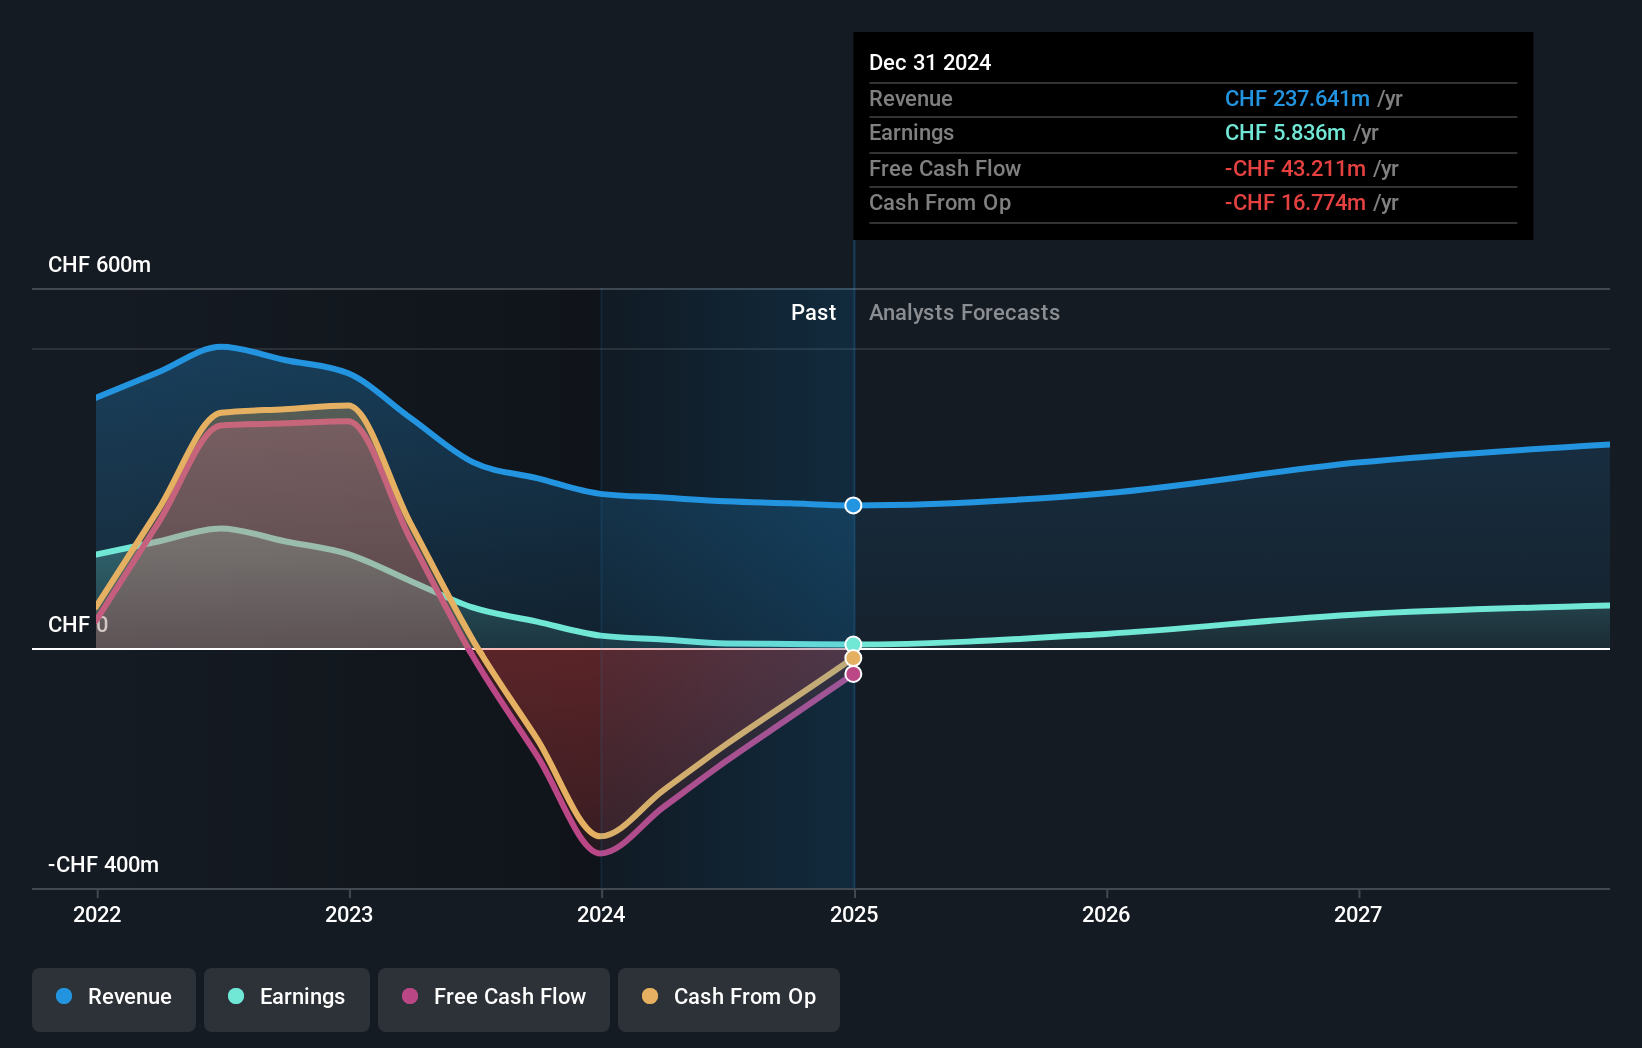
Overview: Leonteq AG is a company that offers derivative investment products and services across Switzerland, Europe, Asia, and internationally with a market cap of CHF291.41 million.
Operations: Leonteq AG generates revenue from its brokerage segment, amounting to CHF170.35 million.
Insider Ownership: 12.3%
Revenue Growth Forecast: 13.3% p.a.
Leonteq is forecast to achieve profitability within three years, with annual earnings growth projected at 45.59% and revenue growth at 13.3%, outpacing the Swiss market. Trading at a good value relative to peers, Leonteq recently concluded all regulatory proceedings with FINMA, enhancing business clarity and execution certainty. Despite low future return on equity forecasts (6.5%), substantial investments in compliance and risk management have strengthened its operational framework significantly.
- Click here and access our complete growth analysis report to understand the dynamics of Leonteq.
- Our comprehensive valuation report raises the possibility that Leonteq is priced lower than what may be justified by its financials.
Shoper (WSE:SHO)
Simply Wall St Growth Rating: ★★★★☆☆
Overview: Shoper S.A. offers software as a service solutions for e-commerce in Poland and has a market cap of PLN1.16 billion.
Operations: The company's revenue segments include Solutions, generating PLN168.67 million, and Subscriptions, contributing PLN44.70 million.
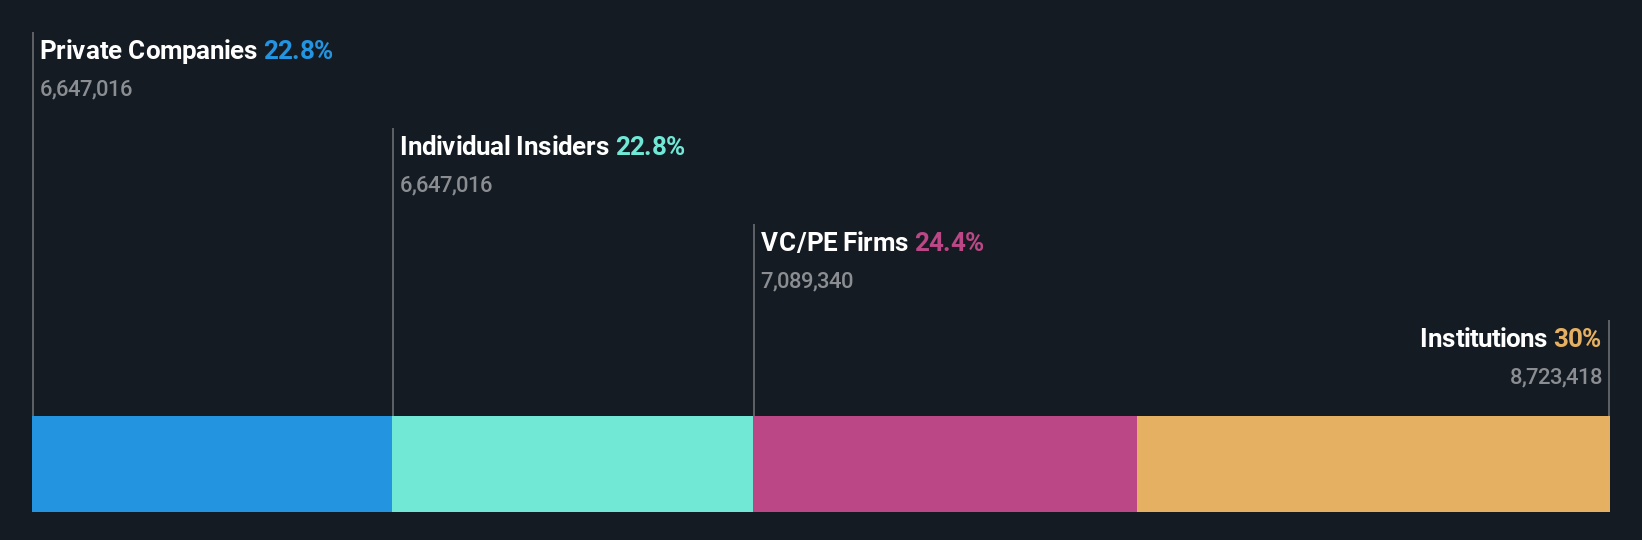
Insider Ownership: 16.3%
Revenue Growth Forecast: 13.5% p.a.
Shoper is positioned for growth with earnings projected to increase by 18.9% annually, outpacing the Polish market's 12%. Despite trading at a 30.2% discount to its estimated fair value, analysts expect a potential price rise of 33%. Recent earnings reports show net income rising to PLN 11.96 million from PLN 9.82 million year-on-year, reflecting steady financial performance despite a recent dividend decrease announcement.
- Navigate through the intricacies of Shoper with our comprehensive analyst estimates report here.
- Insights from our recent valuation report point to the potential undervaluation of Shoper shares in the market.
Turning Ideas Into Actions
- Click through to start exploring the rest of the 206 Fast Growing European Companies With High Insider Ownership now.
- Ready For A Different Approach? Explore 26 top quantum computing companies leading the revolution in next-gen technology and shaping the future with breakthroughs in quantum algorithms, superconducting qubits, and cutting-edge research.
This article by Simply Wall St is general in nature. We provide commentary based on historical data and analyst forecasts only using an unbiased methodology and our articles are not intended to be financial advice. It does not constitute a recommendation to buy or sell any stock, and does not take account of your objectives, or your financial situation. We aim to bring you long-term focused analysis driven by fundamental data. Note that our analysis may not factor in the latest price-sensitive company announcements or qualitative material. Simply Wall St has no position in any stocks mentioned.The analysis only considers stock directly held by insiders. It does not include indirectly owned stock through other vehicles such as corporate and/or trust entities. All forecast revenue and earnings growth rates quoted are in terms of annualised (per annum) growth rates over 1-3 years.
Have feedback on this article? Concerned about the content? Get in touch with us directly. Alternatively, email editorial-team@simplywallst.com