
Global Stocks Trading Up To 46.6% Below Intrinsic Value Estimates
Global markets have been navigating a complex landscape characterized by Middle East tensions and energy market volatility, with major indices showing mixed performance as investors weigh geopolitical risks against economic data. In this environment, identifying undervalued stocks can be particularly appealing to investors seeking opportunities that may offer potential value relative to their intrinsic worth. A good stock in such conditions often exhibits strong fundamentals and resilience amid broader market uncertainties, making it an attractive candidate for those looking to capitalize on potential discrepancies between current prices and intrinsic value estimates.
Top 10 Undervalued Stocks Based On Cash Flows
| Name | Current Price | Fair Value (Est) | Discount (Est) |
| Zylox-Tonbridge Medical Technology (SEHK:2190) | HK$19.28 | HK$38.12 | 49.4% |
| Zhongji Innolight (SZSE:300308) | CN¥1184.05 | CN¥2344.06 | 49.5% |
| Vossloh (XTRA:VOS) | €62.30 | €123.49 | 49.5% |
| Samsung Electro-Mechanics (KOSE:A009150) | ₩1261000.00 | ₩2491451.04 | 49.4% |
| Rakuten Bank (TSE:5838) | ¥5804.00 | ¥11510.32 | 49.6% |
| Murapol (WSE:MUR) | PLN37.90 | PLN75.27 | 49.7% |
| Koskisen Oyj (HLSE:KOSKI) | €8.74 | €17.41 | 49.8% |
| Hanwha Engine (KOSE:A082740) | ₩43250.00 | ₩86272.34 | 49.9% |
| CSPC Innovation Pharmaceutical (SZSE:300765) | CN¥37.39 | CN¥74.24 | 49.6% |
| Brisa Bridgestone Sabanci Lastik Sanayi ve Ticaret (IBSE:BRISA) | TRY80.70 | TRY159.17 | 49.3% |
Let's review some notable picks from our screened stocks.
Techwing (KOSDAQ:A089030)
Overview: Techwing, Inc., along with its subsidiaries, focuses on the development, manufacturing, sales, and servicing of semiconductor inspection equipment both in South Korea and internationally, with a market cap of ₩1.57 trillion.
Operations: Techwing generates revenue through the development, production, sales, and servicing of semiconductor inspection equipment across domestic and international markets.
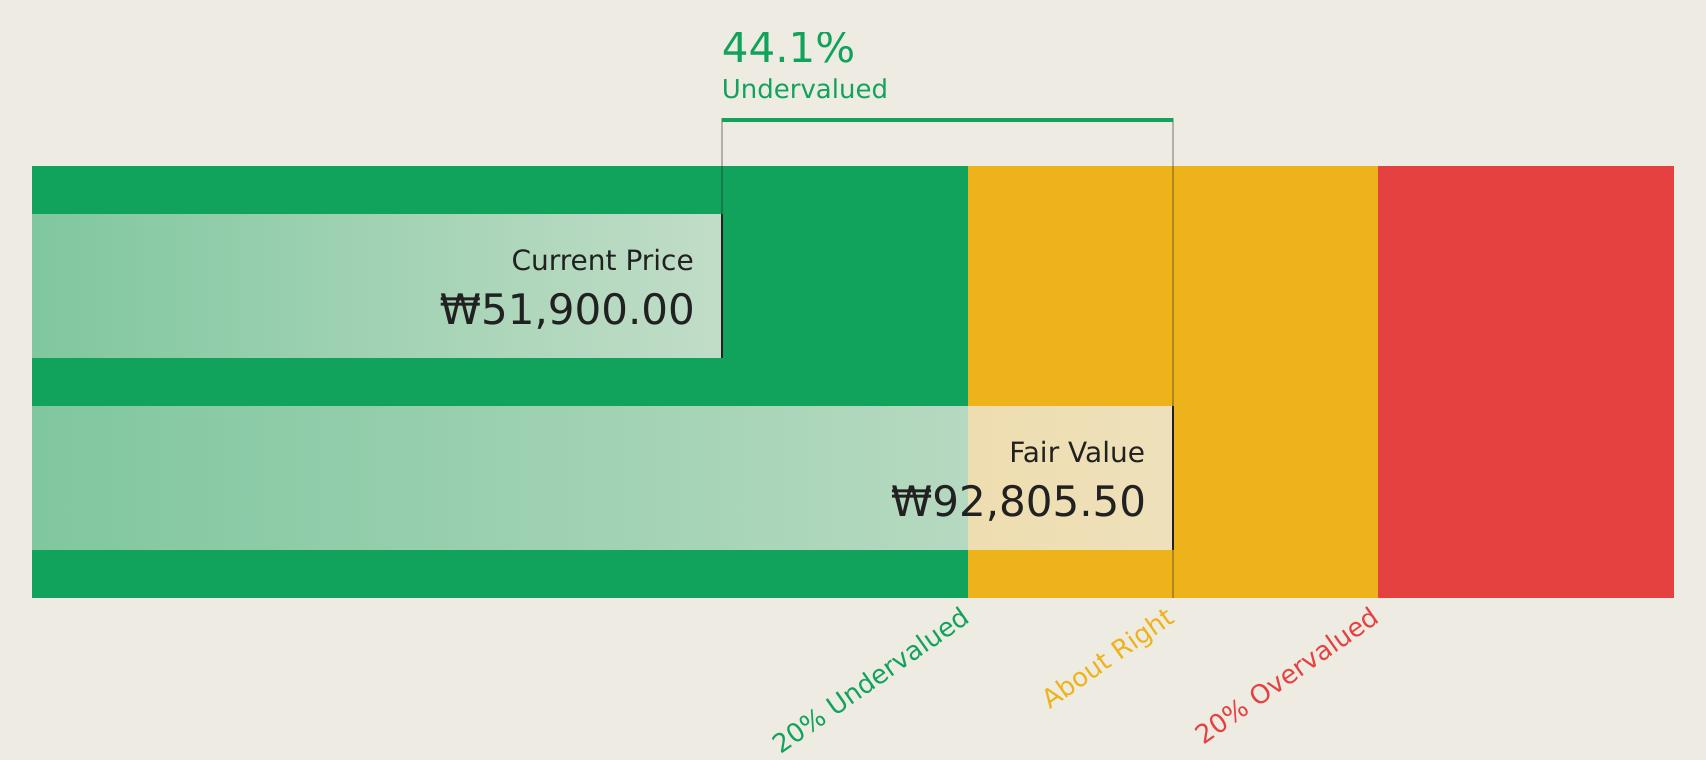
Estimated Discount To Fair Value: 46.6%
Techwing is trading at ₩48,450, significantly below its estimated future cash flow value of ₩90,673.53. Despite a volatile share price and first-quarter net loss of KRW 6.15 billion, the company shows promise with forecasted earnings growth of 100% per year and revenue growth of 47.2% annually, outpacing the Korean market's rate. However, interest payments remain inadequately covered by earnings, which could pose financial challenges moving forward.
- Our earnings growth report unveils the potential for significant increases in Techwing's future results.
- Click here and access our complete balance sheet health report to understand the dynamics of Techwing.
JX Advanced Metals (TSE:5016)
Overview: JX Advanced Metals Corporation is engaged in the development, manufacturing, and sale of copper and rare metal materials in Japan, with a market capitalization of ¥3.65 trillion.
Operations: The company generates revenue through its segments in Base Materials (¥407.88 billion), Semiconductor Materials (¥177.20 billion), and Information and Communication Materials (¥318.74 billion).
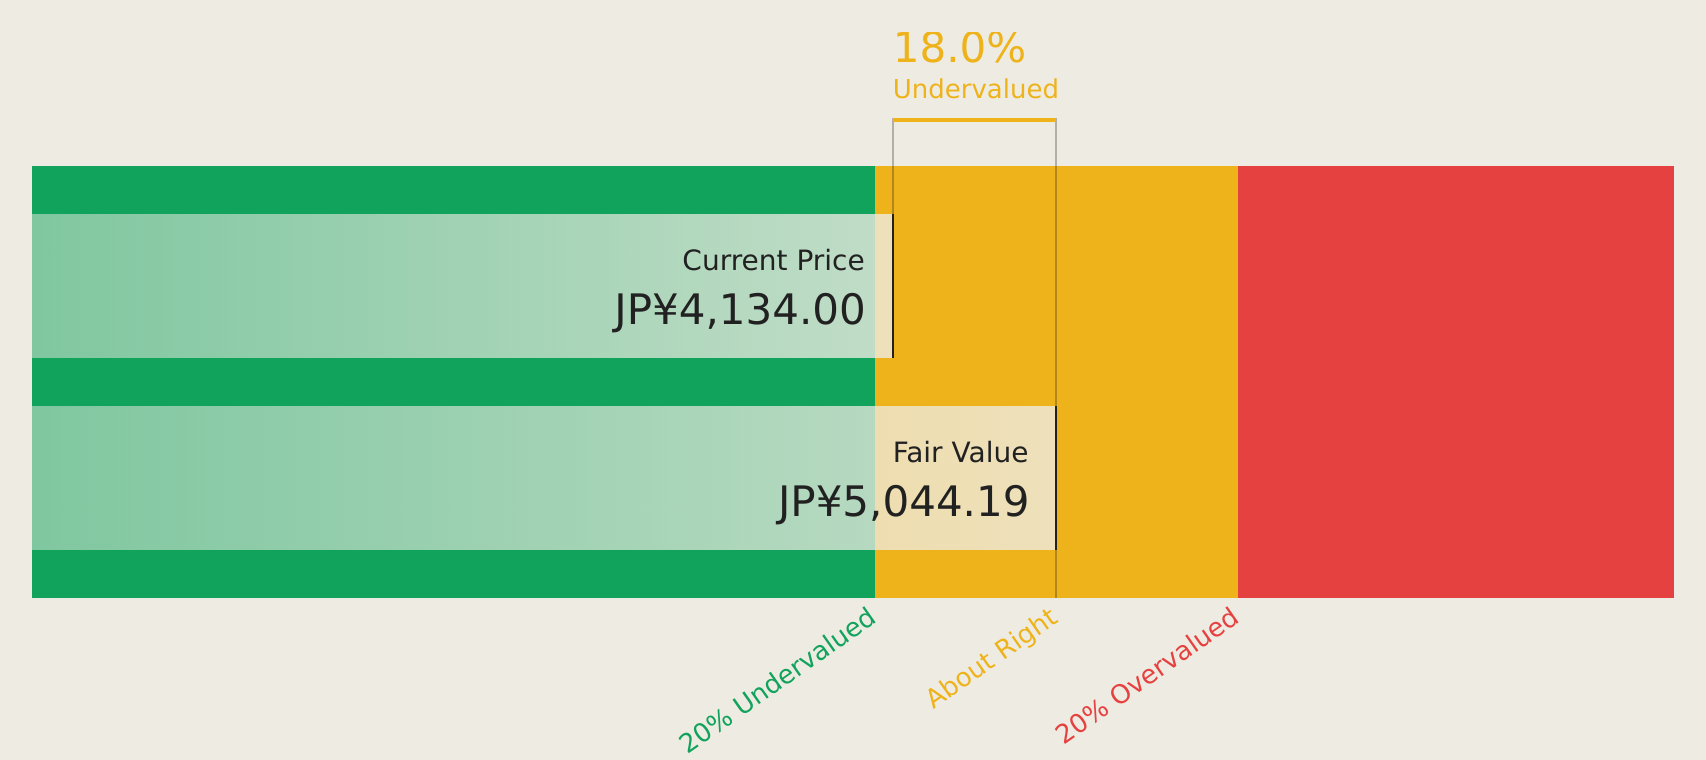
Estimated Discount To Fair Value: 22.9%
JX Advanced Metals is trading at ¥3,886, below its estimated future cash flow value of ¥5,041.27. The company recently completed a significant share buyback of 57.3 million shares for ¥194.88 billion and issued zero-coupon convertible bonds totaling over ¥284 billion to enhance shareholder value. Despite being dropped from the S&P Japan Mid Cap 100, it was added to major indices like S&P Global 1200, reflecting strategic positioning in global markets.
- Our comprehensive growth report raises the possibility that JX Advanced Metals is poised for substantial financial growth.
- Navigate through the intricacies of JX Advanced Metals with our comprehensive financial health report here.
Hon. Precision (TWSE:7769)
Overview: Hon. Precision, Inc. operates in Taiwan, focusing on the manufacture and sale of machinery and related components, automatic control equipment engineering, and machinery installations, with a market cap of NT$1.21 trillion.
Operations: The company's revenue from machinery and industrial equipment amounts to NT$35.08 billion.
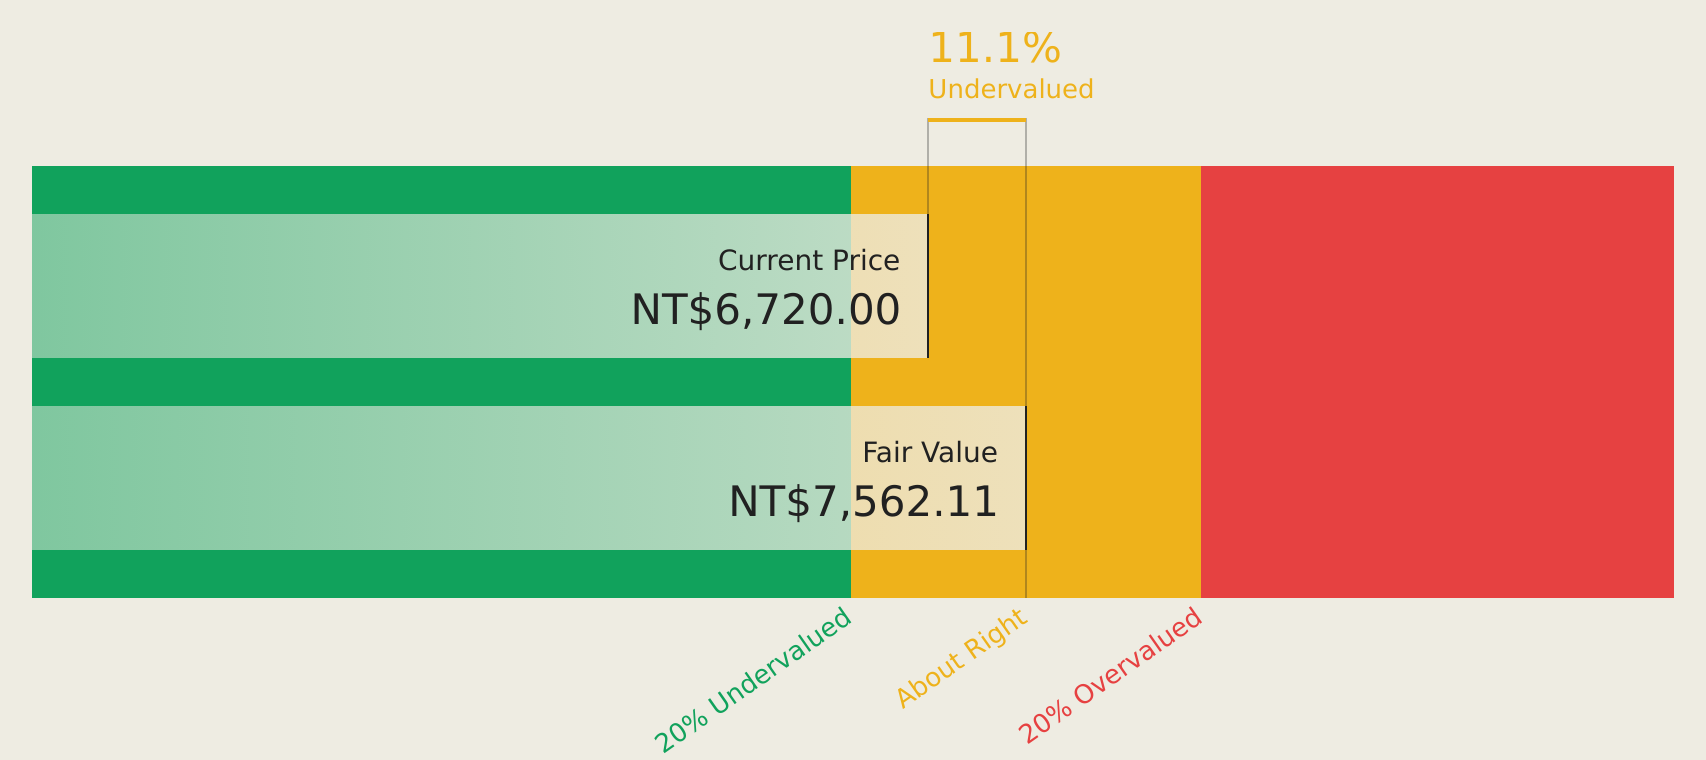
Estimated Discount To Fair Value: 11.3%
Hon. Precision is trading at NT$6,370, below its estimated future cash flow value of NT$7,179.37. Despite recent share price volatility, the company demonstrates strong fundamentals with earnings growing by 107.9% over the past year and forecasted revenue growth of 47% annually—outpacing market averages. Recent first-quarter results showed sales of NT$10.73 billion and a net income increase to NT$4.62 billion from the previous year, reinforcing its undervaluation based on cash flows.
- The analysis detailed in our Hon. Precision growth report hints at robust future financial performance.
- Click here to discover the nuances of Hon. Precision with our detailed financial health report.
Seize The Opportunity
- Access the full spectrum of 404 Undervalued Global Stocks Based On Cash Flows by clicking on this link.
- Hold shares in these firms? Setup your portfolio in Simply Wall St to seamlessly track your investments and receive personalized updates on your portfolio's performance.
- Invest smarter with the free Simply Wall St app providing detailed insights into every stock market around the globe.
Contemplating Other Strategies?
- Explore high-performing small cap companies that haven't yet garnered significant analyst attention.
- Diversify your portfolio with solid dividend payers offering reliable income streams to weather potential market turbulence.
- Fuel your portfolio with companies showing strong growth potential, backed by optimistic outlooks both from analysts and management.
This article by Simply Wall St is general in nature. We provide commentary based on historical data and analyst forecasts only using an unbiased methodology and our articles are not intended to be financial advice. It does not constitute a recommendation to buy or sell any stock, and does not take account of your objectives, or your financial situation. We aim to bring you long-term focused analysis driven by fundamental data. Note that our analysis may not factor in the latest price-sensitive company announcements or qualitative material. Simply Wall St has no position in any stocks mentioned.
Have feedback on this article? Concerned about the content? Get in touch with us directly. Alternatively, email editorial-team@simplywallst.com