
TransUnion (TRU) Mortgage Data Update Puts Its Valuation Back In Focus
Product update puts TransUnion’s mortgage data capabilities in focus
TransUnion (TRU) has drawn fresh investor attention after adding TruVision Alternative Credit Attributes 2.0 from its FactorTrust Alternative Lending Database to its mortgage credit report. The update expands lender insight beyond traditional credit files.
See our latest analysis for TransUnion.
The TruVision update arrives after a strong 1 month share price return of 23.91% and a 7 day share price gain of 6.44%. However, TransUnion’s year to date share price return is down 4.18% and the 1 year total shareholder return is down 14.17%. This suggests that short term momentum has picked up while longer term returns have been weaker.
If this kind of data focused story interests you, it can be worth widening the lens and checking out 18 top founder-led companies
After a sharp 1 month rebound, TransUnion still trades below both analyst targets and an internal fair value estimate. Is the discount pointing to excessive caution on the stock, or is the market simply pricing the risks correctly?
Most Popular Narrative: 11.4% Undervalued
On the most followed view of TransUnion, a fair value of $90.10 sits above the last close at $79.85, which keeps the current discount in sharp focus.
Strategic innovation investments, including AI, machine learning, and the roll-out of the global cloud-native OneTru platform, are driving efficiency, faster product launches, better cross-sell opportunities, and improved customer retention, positioning TransUnion to grow earnings with higher operating leverage and net margins as technology transformation costs subside post-2025.
Want to see why this narrative argues TransUnion can earn more from the same data assets? The heart of the story is steady growth, firm margins and a future earnings multiple that assumes the transformation pays off.
Result: Fair Value of $90.10 (UNDERVALUED)
Have a read of the narrative in full and understand what's behind the forecasts.
However, investors still need to weigh the risk that tighter data privacy rules or a major cyber incident could affect TransUnion’s growth plans and margins.
Find out about the key risks to this TransUnion narrative.
Another View on TransUnion’s valuation
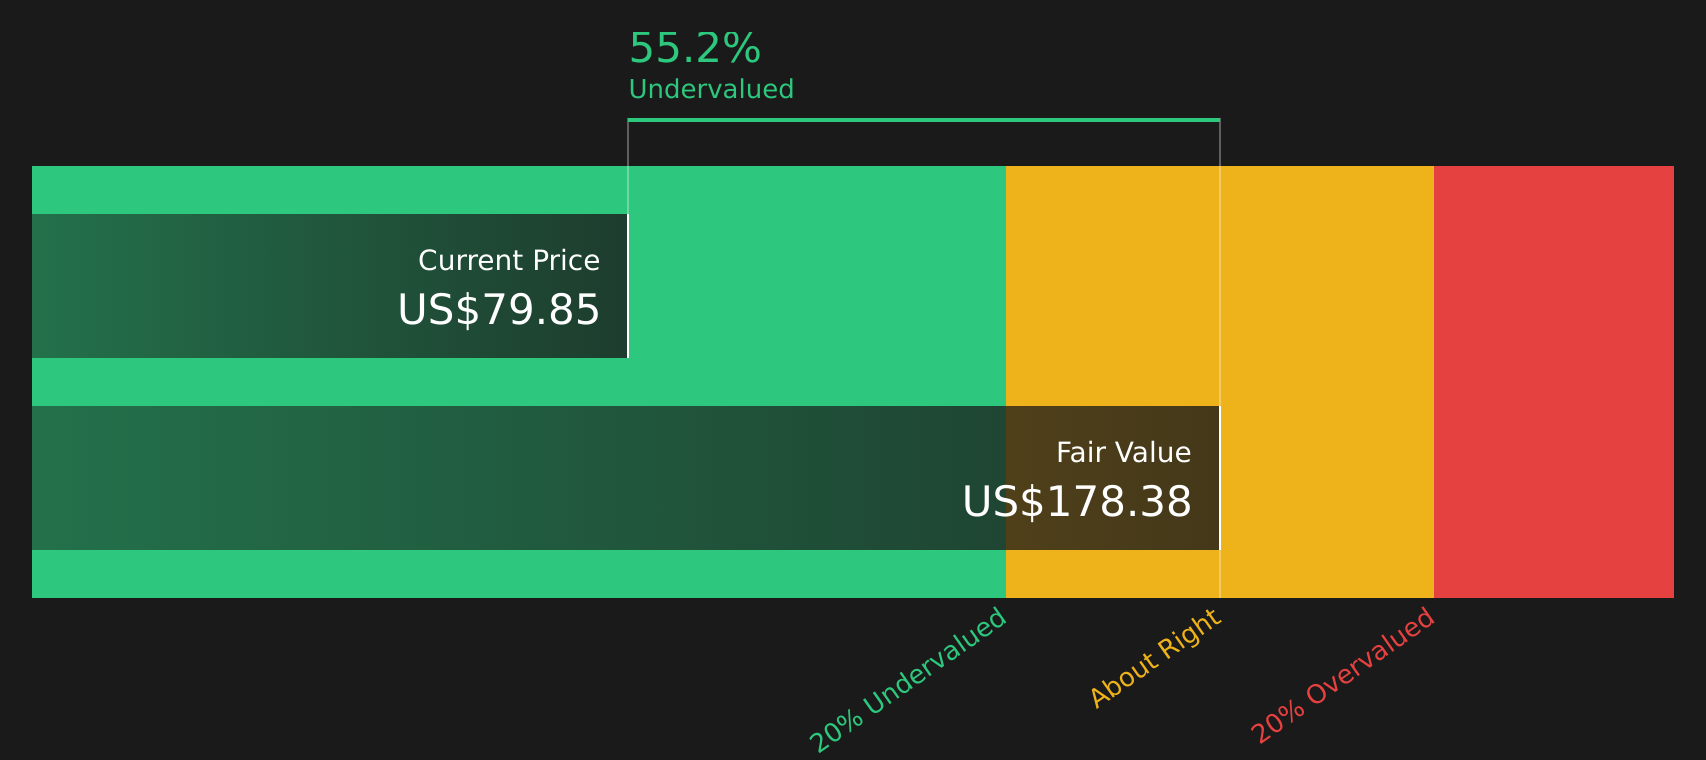
While the narrative fair value of $90.10 suggests TransUnion is 11.4% undervalued, the SWS DCF model is far more optimistic. On this view, the stock at $79.85 trades at a very large discount to an estimated future cash flow value of $178.71, which raises the question of which lens you trust more.
Look into how the SWS DCF model arrives at its fair value.
Next Steps
With mixed signals around TransUnion’s recent moves and valuation, this is a moment to check the underlying data yourself and move quickly to form your own view by weighing the 3 key rewards and 2 important warning signs
Looking for more investment ideas beyond TransUnion?
Do not stop your research with TransUnion. Widen your watchlist and uncover fresh angles on risk, income and value that other investors may be overlooking.
- Target resilient companies first by scanning 84 resilient stocks with low risk scores that aim to balance potential returns with more controlled downside.
- Hunt for value by reviewing 47 high quality undervalued stocks that pair solid fundamentals with prices that may not fully reflect their underlying strength.
- Build your income playbook by checking 8 dividend fortresses that focus on higher yields with an eye on sustainability.
This article by Simply Wall St is general in nature. We provide commentary based on historical data and analyst forecasts only using an unbiased methodology and our articles are not intended to be financial advice. It does not constitute a recommendation to buy or sell any stock, and does not take account of your objectives, or your financial situation. We aim to bring you long-term focused analysis driven by fundamental data. Note that our analysis may not factor in the latest price-sensitive company announcements or qualitative material. Simply Wall St has no position in any stocks mentioned.
Have feedback on this article? Concerned about the content? Get in touch with us directly. Alternatively, email editorial-team@simplywallst.com