
Is Apollo Global Management (APO) Undervalued Following Its EasyJet Takeover Bid?
Apollo Global Management (APO) has moved into the spotlight after easyJet backed its surprise takeover offer, valuing the airline at about £5.7b and setting up a bidding contest with rival suitor Castlelake.
See our latest analysis for Apollo Global Management.
Beyond the EasyJet bid, Apollo Global Management has been busy on the deal front. It recently closed the acquisitions of Emerald Holding and Questex and combined them into a single B2B events and media platform. This comes at a time when the 1 month share price return has fallen 13.27%, and the 5 year total shareholder return of 124.26% contrasts with a 19.48% decline over the past year, suggesting that long term holders have still seen strong gains while recent momentum has cooled.
If this kind of deal activity has your attention, it can be useful to see what else is out there. Now could be a good time to check out 18 top founder-led companies
Apollo Global Management has pulled back after a strong multi year run, while deal activity and analyst targets still sit ahead of the current US$120.47 share price. Is most of the upside already behind the stock, or not?
Price-to-Earnings of 60.1x: Is it justified?
On one hand, Apollo Global Management is trading at a discount to both analyst targets and the SWS DCF estimate of future cash flows. On the other hand, the stock carries a P/E of 60.1x, which is high versus both its own fair ratio estimate and its industry.
The P/E multiple compares the current share price with earnings per share, so a higher ratio typically means investors are willing to pay more today for each dollar of earnings. For a diversified financial group like Apollo Global Management, a rich P/E can indicate that the market is pricing in strong future profit growth or treating current earnings as temporarily depressed.
Here, the P/E of 60.1x stands well above the estimated fair P/E of 26.3x that the SWS model suggests the stock could move toward over time. It also sits far above the US diversified financials average of 15.6x and the peer average of 35.7x. This indicates the market is assigning Apollo Global Management a significantly richer earnings multiple than is typical across the sector and its closest comparables.
Explore the SWS fair ratio for Apollo Global Management
Result: Price-to-Earnings of 60.1x (OVERVALUED)
However, Apollo Global Management's high 60.1x P/E and recent share price declines, including a 19.48% drop over the past year, could challenge the bullish narrative.
Find out about the key risks to this Apollo Global Management narrative.
Another view on Apollo Global Management's value
While the 60.1x P/E suggests Apollo Global Management is richly priced, the SWS DCF model points in the opposite direction, indicating the stock is trading about 10.8% below its estimated future cash flow value of roughly $135.05. Which signal do you treat as more important?
Look into how the SWS DCF model arrives at its fair value.
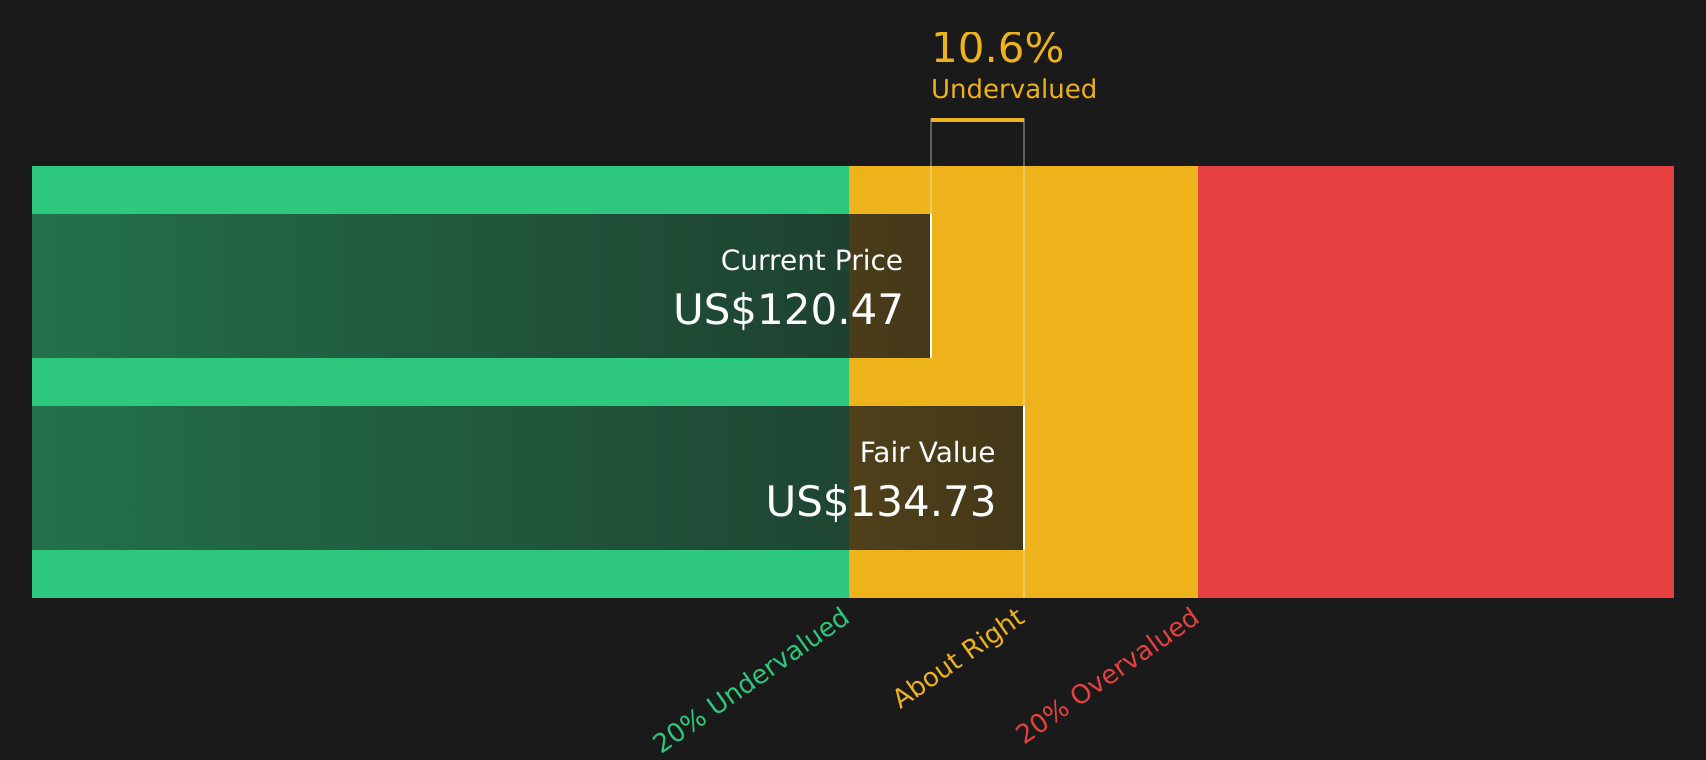
Simply Wall St performs a discounted cash flow (DCF) on every stock in the world every day (check out Apollo Global Management for example). We show the entire calculation in full. You can track the result in your watchlist or portfolio and be alerted when this changes, or use our stock screener to discover 47 high quality undervalued stocks. If you save a screener we even alert you when new companies match - so you never miss a potential opportunity.
Next Steps
If the mixed signals around Apollo Global Management leave you unsure, take a close look at the facts, weigh both the risks and the potential rewards, and see how they line up with your own expectations by reviewing the 3 key rewards and 3 important warning signs
Looking for more investment ideas beyond Apollo Global Management?
If you are weighing Apollo Global Management, do not stop there. Broaden your watchlist with other clear ideas sourced from focused Simply Wall St screeners.
- Target steady compounding potential by reviewing companies highlighted in the 84 resilient stocks with low risk scores.
- Spot opportunities where quality and price intersect using the screener containing 20 high quality undiscovered gems.
- Lock in income focused ideas by scanning the 8 dividend fortresses.
This article by Simply Wall St is general in nature. We provide commentary based on historical data and analyst forecasts only using an unbiased methodology and our articles are not intended to be financial advice. It does not constitute a recommendation to buy or sell any stock, and does not take account of your objectives, or your financial situation. We aim to bring you long-term focused analysis driven by fundamental data. Note that our analysis may not factor in the latest price-sensitive company announcements or qualitative material. Simply Wall St has no position in any stocks mentioned.
Have feedback on this article? Concerned about the content? Get in touch with us directly. Alternatively, email editorial-team@simplywallst.com