
How June’s Same-Store Sales Gain With Softer Volumes Will Impact IDT (IDT) Investors
- In early July 2026, NRSInsights reported that IDT’s June 2026 same-store sales rose 3.4% year over year, while units sold fell 1.5% compared to a year earlier.
- The combination of higher same-store sales but fewer units sold suggests consumers may be purchasing fewer items at higher prices or shifting toward higher-value products, reshaping how IDT’s retail data is interpreted.
- We’ll now examine how June’s 3.4% same-store sales growth, alongside softer unit volumes, feeds into IDT’s existing investment narrative.
Uncover the next big thing with 20 elite penny stocks that balance risk and reward.
IDT Investment Narrative Recap
To own IDT, you need to believe in the company’s ability to grow its communications, payments, and retail data platforms while managing capital intensive operations and acquisition driven expansion. June’s 3.4% same store sales growth and softer units at NRS appear directionally consistent with its data and services led thesis and do not materially change the near term focus on execution or the key risk around capital allocation across dividends, buybacks and growth.
The most relevant recent announcement here is IDT’s June 3, 2026 earnings release, which showed higher year on year sales and net income for the nine months ended April 30, 2026. Against that backdrop, the June NRSInsights data gives investors fresh, very short term context on how retail traffic and pricing trends might influence NRS driven recurring revenue, a key part of the company’s catalyst around expanding features and penetration with independent retailers.
Yet investors should be aware that increasing cash outlays for dividends and buybacks could eventually constrain...
Read the full narrative on IDT (it's free!)
IDT's narrative projects $1.3 billion revenue and $104.9 million earnings by 2028. This implies a 0.7% yearly revenue decline and an $8.9 million earnings increase from $96.0 million today.
Uncover how IDT's forecasts yield a $75.00 fair value, a 19% upside to its current price.
Exploring Other Perspectives
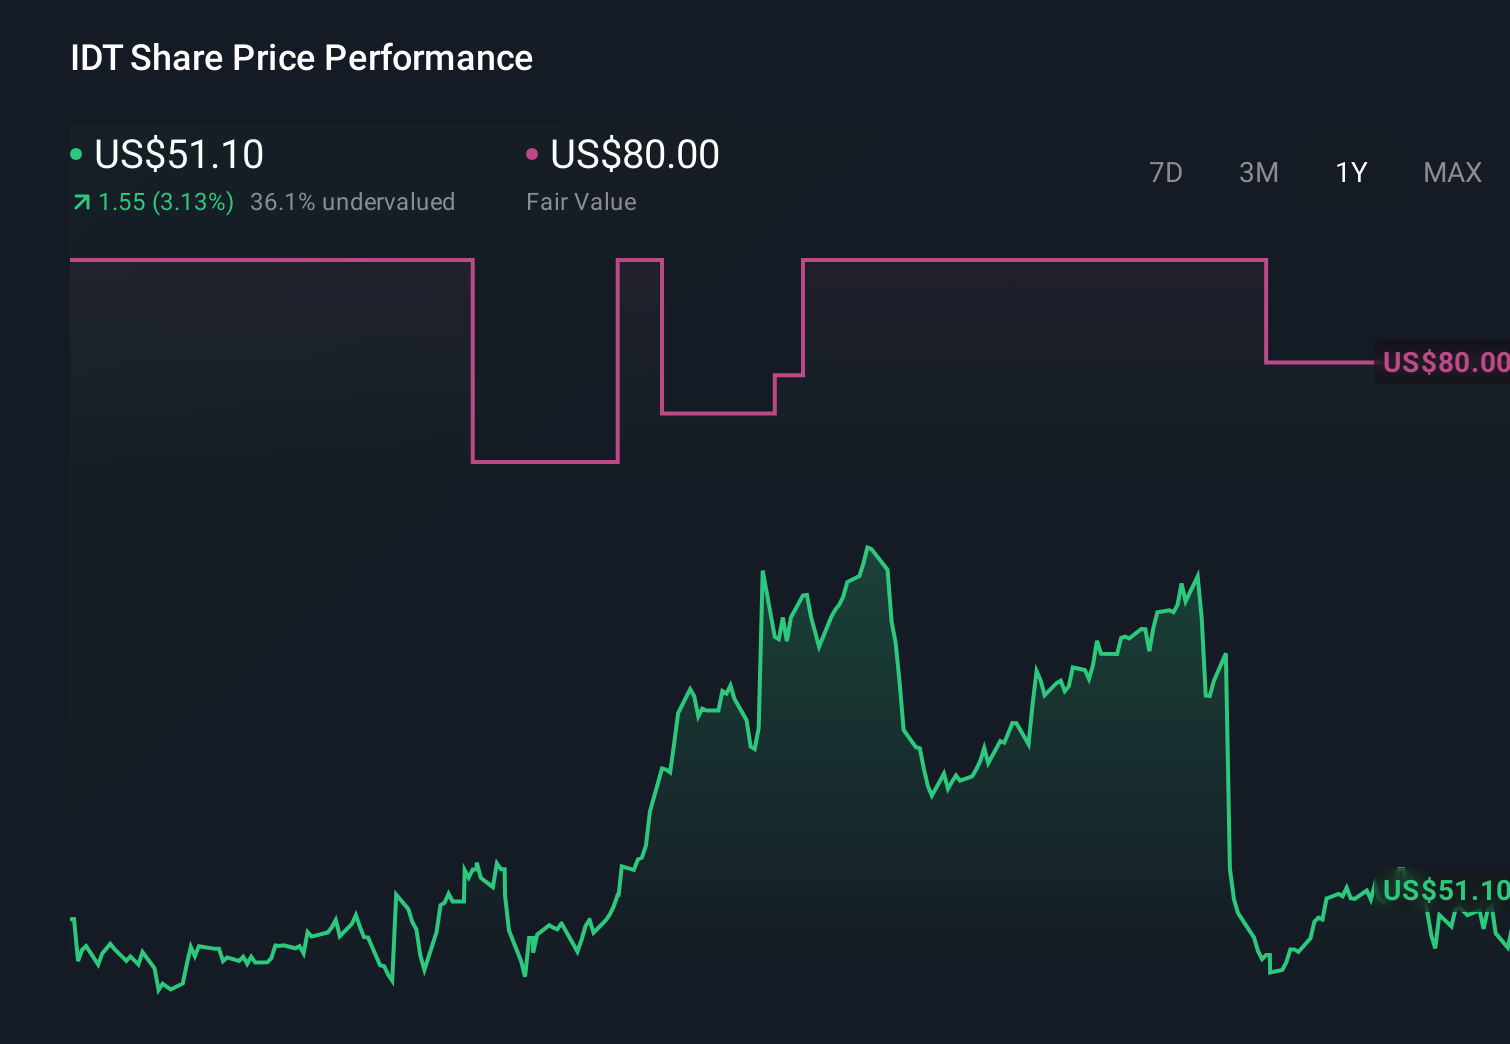
Seven fair value estimates from the Simply Wall St Community range from US$36.30 to US$56,221.18, showing how far opinions can stretch. Set this against the reliance on NRS feature expansion to support growth and you can compare very different views on what might matter most for IDT’s future performance.
Explore 7 other fair value estimates on IDT - why the stock might be worth 43% less than the current price!
Form Your Own Verdict
Disagree with existing narratives? Extraordinary investment returns rarely come from following the herd, so go with your instincts.
- A great starting point for your IDT research is our analysis highlighting 2 key rewards and 2 important warning signs that could impact your investment decision.
- Our free IDT research report provides a comprehensive fundamental analysis summarized in a single visual - the Snowflake - making it easy to evaluate IDT's overall financial health at a glance.
Contemplating Other Strategies?
These stocks are moving-our analysis flagged them today. Act fast before the price catches up:
- AI is about to change healthcare. These 39 stocks are working on everything from early diagnostics to drug discovery. The best part - they are all under $10b in market cap - there's still time to get in early.
- This technology could replace computers: discover 26 stocks that are working to make quantum computing a reality.
- Find 47 companies with promising cash flow potential yet trading below their fair value.
This article by Simply Wall St is general in nature. We provide commentary based on historical data and analyst forecasts only using an unbiased methodology and our articles are not intended to be financial advice. It does not constitute a recommendation to buy or sell any stock, and does not take account of your objectives, or your financial situation. We aim to bring you long-term focused analysis driven by fundamental data. Note that our analysis may not factor in the latest price-sensitive company announcements or qualitative material. Simply Wall St has no position in any stocks mentioned.
Have feedback on this article? Concerned about the content? Get in touch with us directly. Alternatively, email editorial-team@simplywallst.com