
Immunome (IMNM) NDA Acceptance Puts Valuation Back In Focus
Immunome (IMNM) is in focus after the FDA accepted its New Drug Application for varegacestat, an oral therapy for adults with desmoid tumors, supported by positive Phase 3 RINGSIDE trial data.
See our latest analysis for Immunome.
The FDA’s acceptance of Immunome’s NDA comes after a mixed period for the stock, with a 20.45% 1 month share price return but a 9.38% decline over three months. The 1 year total shareholder return of 110.96% points to strong longer term momentum.
If this kind of oncology story has your attention, it may be worth broadening your watchlist to see what else is moving across 39 healthcare AI stocks
After Immunome’s sharp run on the NDA news, the stock still trades well below the average analyst price target. The next step is to ask whether the recent move has captured most of the opportunity or not.
Preferred Price-to-Book Multiple of 4.3x: Is It Justified?
Immunome currently trades on a P/B of 4.3x, which screens as good value against a peer average of 14x, but expensive versus the broader US biotechs industry at 2.6x.
P/B compares the company’s market value to its accounting book value, which can be a useful cross check for early stage biotechs that are still loss making and have limited revenue. A 4.3x P/B suggests investors are placing a relatively high value on Immunome’s pipeline, intellectual property and future potential rather than its current $4.0m of revenue and loss of $224.6m.
The gap between different reference points is notable. Against a 14x peer average P/B, Immunome looks much cheaper, which may indicate the stock is not being priced in line with some higher rated oncology peers. Against the 2.6x industry average, that same 4.3x multiple looks demanding, implying the market is already assigning a premium to its platform, trial assets and growth expectations.
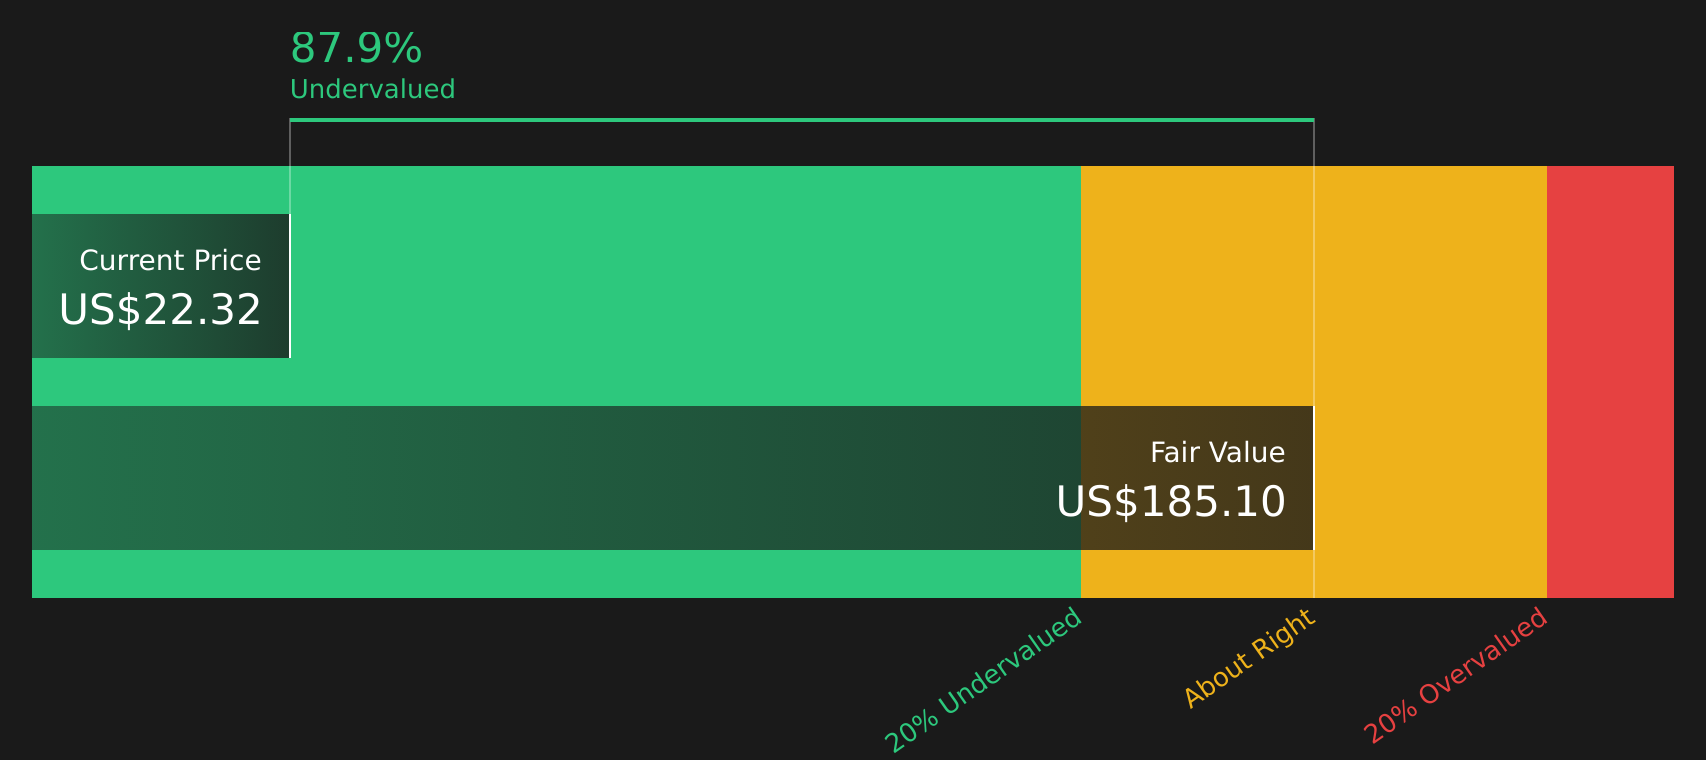
There is no fair ratio available, so the SWS DCF model is the key cross check here. That model values Immunome’s future cash flows at $186.21 per share versus a last close of $22.32, which implies a very large discount and highlights how sensitive valuation can be when a company is unprofitable, has limited current revenue and is heavily dependent on future oncology milestones.
See what the numbers say about this price — find out in our valuation breakdown.
Result: Price-to-book of 4.3x (UNDERVALUED / OVERVALUED MIXED SIGNALS VERSUS DIFFERENT BENCHMARKS)
However, Immunome’s story still carries real risk, including its $224.6m loss and reliance on successful outcomes from varegacestat and other early stage pipeline assets.
Find out about the key risks to this Immunome narrative.
Another View on Immunome’s Valuation
The SWS DCF model presents a very different perspective on Immunome. It values future cash flows at $186.21 per share versus the current $22.32 price, suggesting the stock trades at a very large discount. If the market were to lean toward this view, today’s pricing could look very different.
Any DCF depends heavily on its assumptions, especially for an unprofitable biotech with limited current revenue, so it is worth understanding how sensitive this output is to changes in growth, margins and funding.
Look into how the SWS DCF model arrives at its fair value.
Simply Wall St performs a discounted cash flow (DCF) on every stock in the world every day (check out Immunome for example). We show the entire calculation in full. You can track the result in your watchlist or portfolio and be alerted when this changes, or use our stock screener to discover 47 high quality undervalued stocks. If you save a screener we even alert you when new companies match - so you never miss a potential opportunity.
Next Steps
With Immunome presenting both risks and rewards, it makes sense to look at the underlying data directly and decide how it fits your own approach, then weigh up the balance of 3 key rewards and 3 important warning signs.
Looking For More Investment Ideas Beyond Immunome?
If Immunome has sharpened your focus on opportunities, do not stop here. Instead, widen your search with a few targeted screens that surface different kinds of stocks.
- Target potential bargains by reviewing companies that currently screen as 47 high quality undervalued stocks.
- Prioritize resilience by focusing on 84 resilient stocks with low risk scores that may better match a cautious approach.
- Hunt for future standouts with a screener containing 20 high quality undiscovered gems before they land on everyone else's radar.
This article by Simply Wall St is general in nature. We provide commentary based on historical data and analyst forecasts only using an unbiased methodology and our articles are not intended to be financial advice. It does not constitute a recommendation to buy or sell any stock, and does not take account of your objectives, or your financial situation. We aim to bring you long-term focused analysis driven by fundamental data. Note that our analysis may not factor in the latest price-sensitive company announcements or qualitative material. Simply Wall St has no position in any stocks mentioned.
Have feedback on this article? Concerned about the content? Get in touch with us directly. Alternatively, email editorial-team@simplywallst.com