
Activia Properties (TSE:3279) Looks Fully Valued After Fresh Earnings And Distribution Guidance
Why Activia Properties Guidance Matters For Income Focused Investors
Activia Properties (TSE:3279) recently issued earnings and cash distribution guidance for the fiscal periods ending November 30, 2026 and May 31, 2027, giving investors clearer visibility on expected payouts and profitability.
The company projects operating revenue of ¥18,434 million and profit of ¥8,633 million for November 2026, alongside an expected cash distribution of ¥3,278 per unit. For May 2027, guidance points to ¥17,899 million in operating revenue, profit of ¥8,053 million and a planned distribution of ¥3,279 per unit.
See our latest analysis for Activia Properties.
Activia Properties' ¥139,900 share price has seen a 1 day share price return of 1.82% and a 30 day share price return of 4.79%, while its 1 year total shareholder return of 14.61% indicates firmer momentum than its year to date share price return, which is down 0.99%.
If this guidance has you thinking about where else income and real assets could fit in your portfolio, it may be worth scanning 11 top founder-led companies
After Activia Properties' recent guidance and unit price move, the real tension is between locking in the current yield and clarity today, or holding out for a cheaper entry. So how does the current valuation stack up?
Price to Earnings of 23.2x: Is It Justified for Activia Properties?
On a simple yardstick, Activia Properties looks expensive, with the units at ¥139,900 trading on a P/E of 23.2x compared with both its peers and the wider Asian REITs group.
The P/E multiple compares the current unit price with earnings per unit. A higher ratio usually means investors are willing to pay more today for each unit of current earnings. For a REIT like Activia Properties, which already generates high quality earnings but only modest earnings growth is forecast, a richer P/E can signal that the market is paying up for perceived stability, asset quality or income visibility rather than rapid profit expansion.
Against that backdrop, the comparison lines up clearly. Activia Properties trades on a P/E of 23.2x, while the Asian REITs industry average sits at 17.1x and the direct peer average at 18.8x, so the units carry a clear premium. Relative to an estimated fair P/E of 21x, the current ratio also sits above the level the market could eventually revert toward if expectations cool or earnings do not keep pace.
Explore the SWS fair ratio for Activia Properties
Result: Price-to-Earnings of 23.2x (OVERVALUED)
However, Activia Properties' premium P/E and slight annual revenue decline of 0.70% leave little margin for disappointment if earnings growth or distributions soften.
Find out about the key risks to this Activia Properties narrative.
Another View On Activia Properties Using Our DCF Model
The earlier P/E workup painted Activia Properties as expensive, but the SWS DCF model tells a slightly different story. With the units at ¥139,900 and an estimated future cash flow value of ¥130,219.91, the gap is narrower and points to a more modest degree of overvaluation. So which signal should carry more weight for you right now?
Look into how the SWS DCF model arrives at its fair value.
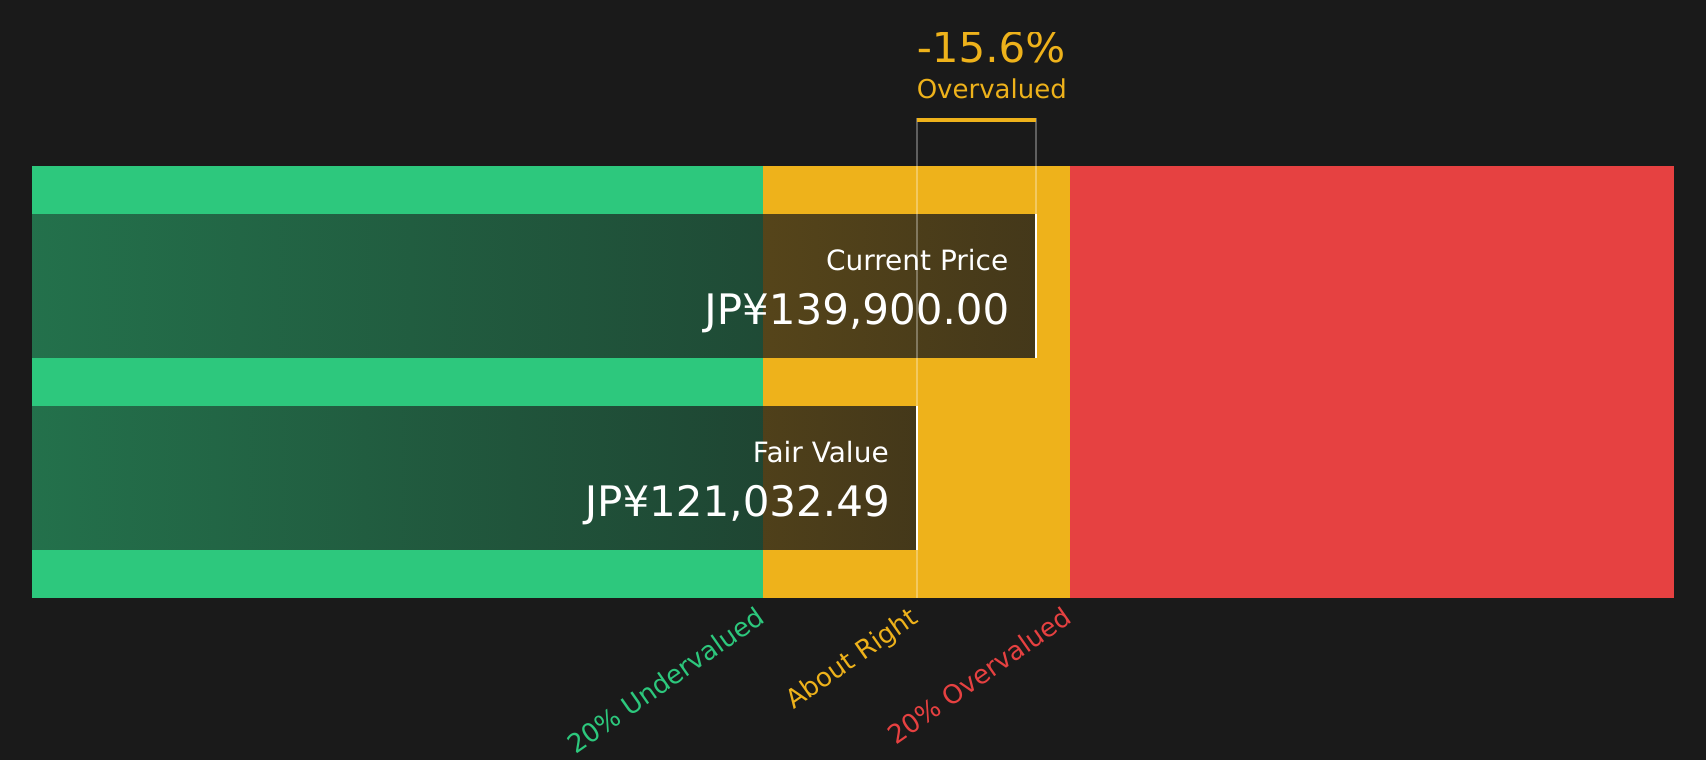
Simply Wall St performs a discounted cash flow (DCF) on every stock in the world every day (check out Activia Properties for example). We show the entire calculation in full. You can track the result in your watchlist or portfolio and be alerted when this changes, or use our stock screener to discover 17 high quality undervalued stocks. If you save a screener we even alert you when new companies match - so you never miss a potential opportunity.
Next Steps
If this overview of Activia Properties seems mixed to you, that is intentional. Use the full set of data to stress test your own view and weigh both sides by starting with 1 key reward and 2 important warning signs.
Looking For More Investment Ideas Beyond Activia Properties?
If Activia Properties has sharpened your focus on valuation and income, do not stop here. Broaden your watchlist with a few focused, data driven stock ideas.
- Target dependable cash generation by checking companies with strong fundamentals in the solid balance sheet and fundamentals stocks screener (37 results) for a starting pool of resilient candidates.
- Hunt for mispriced quality by reviewing companies highlighted in the screener containing 60 high quality undiscovered gems before they attract wider attention.
- Prioritise stability and capital preservation by scanning the 51 resilient stocks with low risk scores to see which businesses currently carry lower overall risk scores.
This article by Simply Wall St is general in nature. We provide commentary based on historical data and analyst forecasts only using an unbiased methodology and our articles are not intended to be financial advice. It does not constitute a recommendation to buy or sell any stock, and does not take account of your objectives, or your financial situation. We aim to bring you long-term focused analysis driven by fundamental data. Note that our analysis may not factor in the latest price-sensitive company announcements or qualitative material. Simply Wall St has no position in any stocks mentioned.
Have feedback on this article? Concerned about the content? Get in touch with us directly. Alternatively, email editorial-team@simplywallst.com