
Is Fabrinet (FN) Fully Priced After Its 419% 5 Year Run?
Fabrinet’s share price has delivered very strong 5 year gains, yet its valuation signals are pulling in different directions, with the intrinsic value estimate pointing to a premium while earnings based multiples suggest the stock screens as cheap.
- Fabrinet has returned 418.7% over 5 years, setting a high bar for what investors may expect from the stock at today’s price.
- Expectations for continued cash generation can support the current valuation, but any disappointment in future revenue or margin trends may weigh heavily on what investors are willing to pay.
- The company scores 3 out of 6 on Simply Wall St’s broader valuation checks, which is a mixed picture rather than a clear bargain or clear overvaluation, and you can see the breakdown at 3.
The issue now is whether Fabrinet’s current share price already reflects most of the good news implied by its recent performance, or if there is still room for gains before valuation becomes a clear headwind.
Find out why Fabrinet's 53.8% return over the last year is lagging behind its peers.
Is Fabrinet Getting Expensive on Cash Flow?
The Discounted Cash Flow (DCF) model for Fabrinet starts with its latest twelve month free cash flow of about $112.8 million and projects it to grow over time. Using a 2 Stage Free Cash Flow to Equity approach, those projected cash flows translate into an estimated intrinsic value of roughly $319.86 per share.
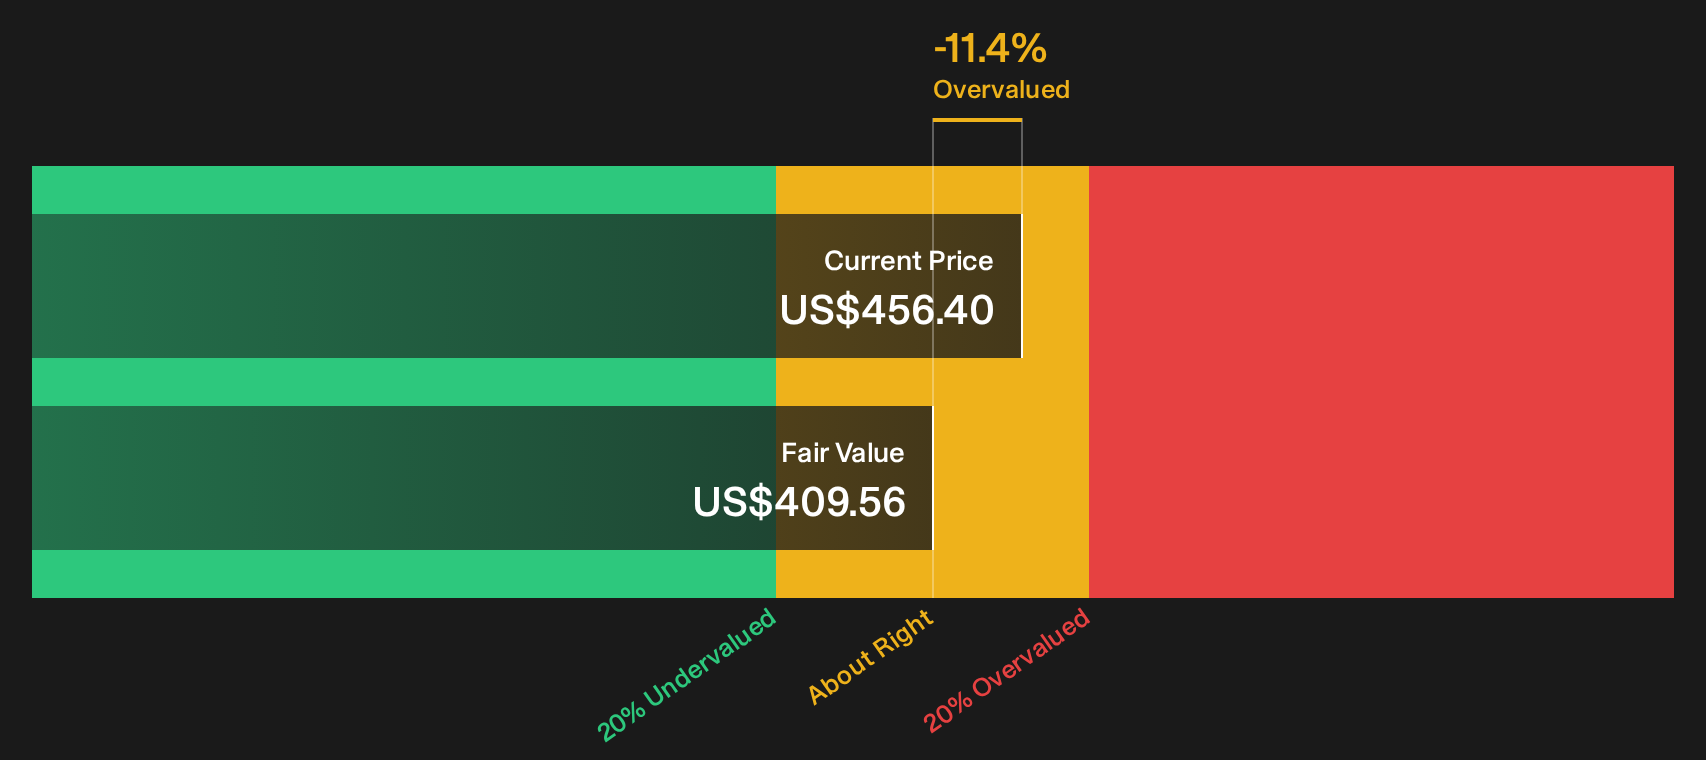
Compared with the current share price, this DCF output implies the stock trades at about a 49.6% premium to that intrinsic value estimate, so Fabrinet screens as overvalued on this cash flow lens. The model assumes growing cash generation from here, so if future free cash flow ends up lower than projected, the gap between price and intrinsic value could appear even wider.
On this DCF view, Fabrinet stock currently looks overvalued relative to its estimated cash flow driven intrinsic value.
Our Discounted Cash Flow (DCF) analysis suggests Fabrinet may be overvalued by 49.6%. Discover 47 high quality undervalued stocks or create your own screener to find better value opportunities.
Does Fabrinet Look Undervalued on Earnings?
The P/E ratio is a useful way to compare what investors are willing to pay for each dollar of Fabrinet’s earnings against similar companies. Fabrinet currently trades on a P/E of about 40.7x, which is above the Electronic industry average of roughly 30.5x but slightly below the peer average near 45.8x.
On Simply Wall St’s fair P/E estimate of around 46.3x, which blends factors such as Fabrinet’s industry, profitability profile and risk, the current multiple sits below what that framework suggests might be justified. That gap indicates the stock appears undervalued on this earnings yardstick, even though it carries a premium to the broader industry average.
Taken together, Fabrinet stock appears undervalued on the P/E multiple compared with the fair ratio benchmark.

See what the numbers say about this price — find out in our valuation breakdown.
The Fabrinet Narrative: What Would Justify Today's Price?
Simply Wall St Narratives for Fabrinet pick up where this valuation split leaves off. They lay out clear, alternative paths for Fabrinet's future growth, margins and earnings, and link each path to what that could mean for the stock’s worth relative to today’s price on the Community page. Each narrative ties its number to a specific view of how Fabrinet's growth, profitability and risks might evolve, giving you a reference point to revisit as new information comes through.
One of the top community narratives on Fabrinet: 25% undervalued
"Secular growth in data and photonics, expanded partnerships, and operational investments position Fabrinet for sustained, diversified revenue growth and margin improvement across multiple end markets..."
Read one of the top narratives on Fabrinet
Do you think there's more to the story for Fabrinet? Head over to our Community to see what others are saying!
The Bottom Line
For Fabrinet, the Discounted Cash Flow (DCF) intrinsic value view points to the stock looking overvalued, while the P/E based view suggests it screens as undervalued relative to a fair ratio benchmark. That tension largely reflects different assumptions, with the intrinsic value model more sensitive to the timing and durability of future cash flows, and the earnings multiple leaning on how much growth and sentiment investors are willing to bake into the current price after a very strong multi year move. The key question from here is whether Fabrinet can sustain the revenue and margin profile that would justify today's earnings multiple without stretching its cash generation too far.
This article by Simply Wall St is general in nature. We provide commentary based on historical data and analyst forecasts only using an unbiased methodology and our articles are not intended to be financial advice. It does not constitute a recommendation to buy or sell any stock, and does not take account of your objectives, or your financial situation. We aim to bring you long-term focused analysis driven by fundamental data. Note that our analysis may not factor in the latest price-sensitive company announcements or qualitative material. Simply Wall St has no position in any stocks mentioned.
Have feedback on this article? Concerned about the content? Get in touch with us directly. Alternatively, email editorial-team@simplywallst.com