
Berkshire Hathaway (BRK.B) Stock May Be 36% Undervalued Despite Buffett Donation Plans
Berkshire Hathaway stock has delivered a 76.3% return over the past 5 years, yet the latest intrinsic value checks suggest the market price may still sit at a discount to what the business is worth.
- A 76.3% gain over 5 years puts Berkshire Hathaway firmly in positive territory, raising the question of whether the valuation case still points to further upside or if much of the opportunity is already reflected in the price.
- Greg Abel’s tilt of the portfolio toward large technology and AI focused holdings like Apple and Alphabet can support long term cash generation. At the same time, concentration in a few big positions and exposure to sectors such as airlines may increase the risk that swings in those areas have an outsized impact on intrinsic value.
- The stock screens as undervalued on the Excess Returns intrinsic value estimate and on market multiples, and the broader checks lean cheap, with Berkshire Hathaway passing 5 out of 6 valuation tests.
The issue now is whether Berkshire Hathaway’s current price already fairly reflects these strengths and risks, or if the gap to the intrinsic value estimate still offers a margin of safety for long term investors.
Is Berkshire Hathaway a Bargain on Excess Returns?
The Excess Returns model values Berkshire Hathaway by comparing what it earns on shareholder equity to the return investors typically require.
On this basis, Berkshire Hathaway is modeled with book value of $505,559.42 per share and stable EPS of $63,684.58 per share, derived from an average return on equity of 11.75%. With a cost of equity of $40,007.43 per share, the framework implies excess return of $23,677.14 per share on a stable book value base of $542,107.44 per share. This points to a business that is earning more on its equity than the model says investors demand.
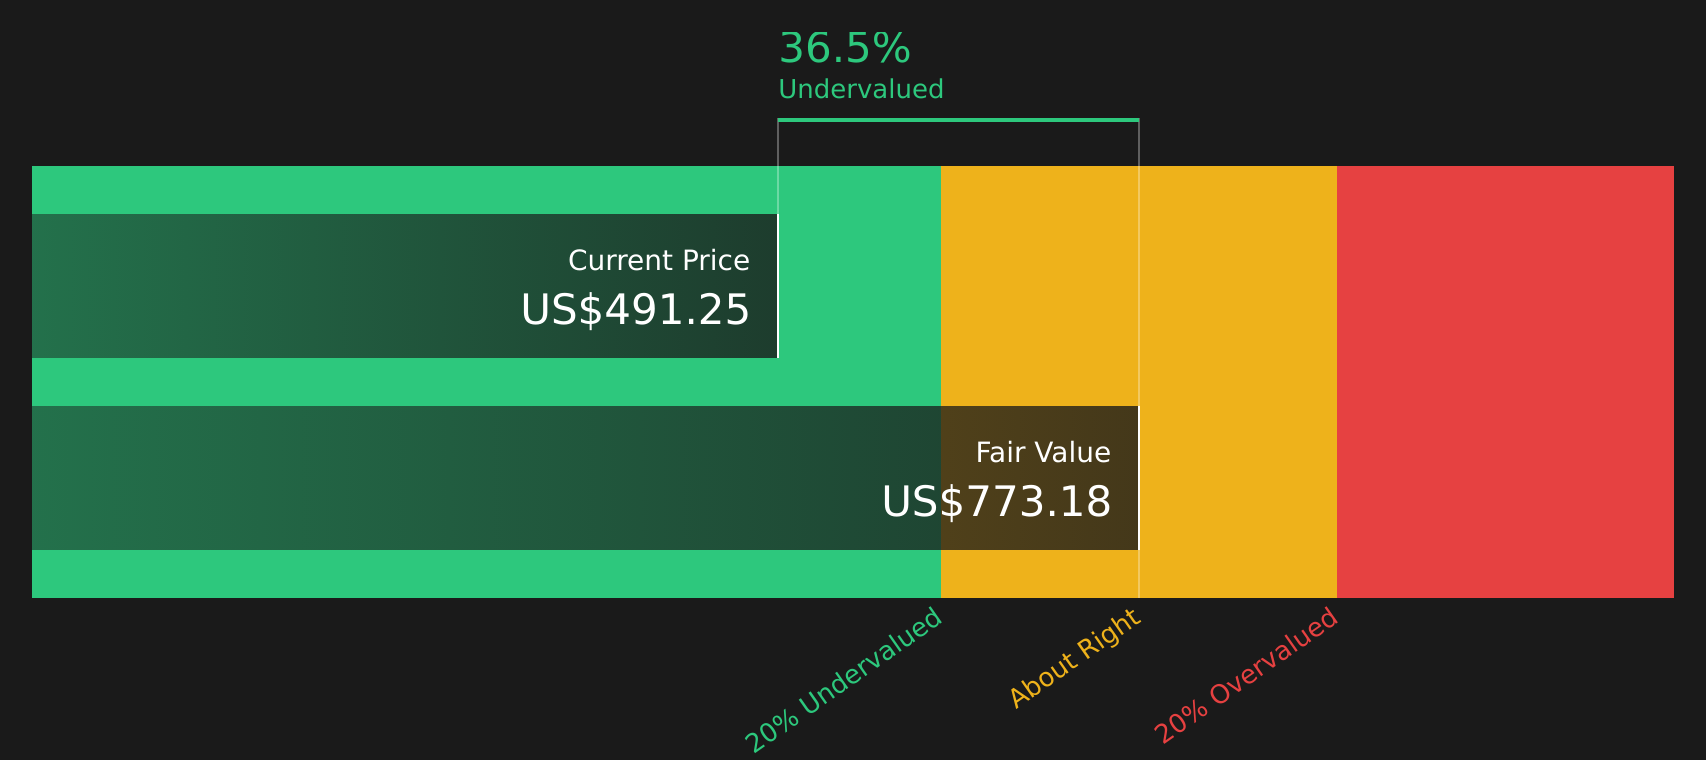
Those inputs feed into an Excess Returns intrinsic value estimate of $772.85 per share, which sits well above the current share price and implies Berkshire Hathaway screens about 36.5% undervalued on this methodology. The recent tilt toward large technology and AI holdings under Greg Abel helps explain why some investors may be cautious on concentration risk. Even so, the model indicates the market price is not fully reflecting the projected return on equity.
Overall, the Excess Returns workup suggests Berkshire Hathaway stock currently looks undervalued relative to the earnings power implied by its equity base.
Our Excess Returns analysis suggests Berkshire Hathaway is undervalued by 36.5%. Track this in your watchlist or portfolio, or discover 47 more high quality undervalued stocks.
Does Berkshire Hathaway Look Undervalued on Earnings?
The P/E ratio is a useful way to look at Berkshire Hathaway because it ties directly to the company’s reported earnings power. Berkshire Hathaway currently trades on a P/E of 14.6x, compared with about 15.9x for the wider Diversified Financial industry and 23.8x for its peer group.
The fair P/E ratio, which blends factors such as Berkshire Hathaway’s size, margins and sector with a risk adjustment, is 17.7x. That is above the current 14.6x, suggesting the stock trades at a discount to where this framework would typically place it relative to its fundamentals and industry position.
On this P/E yardstick, Berkshire Hathaway stock appears undervalued compared with both its tailored fair multiple and broader peers.

See what the numbers say about this price — find out in our valuation breakdown.
The Berkshire Hathaway Narrative: What Would Justify Today's Price?
Simply Wall St Narratives for Berkshire Hathaway pick up where the valuation work leaves off by spelling out what would need to happen to Berkshire Hathaway’s future growth, margins and earnings for the stock to be worth materially more or materially less than today’s price. Rather than relying on a single multiple or model result, each Narrative sets out the assumptions behind its fair value so you can compare them with actual results as they are reported, and they sit on Simply Wall St’s Community page.
Now is a good time to add your voice to the Simply Wall St community with a number driven Narrative on Berkshire Hathaway, weighing in on how Greg Abel’s tilt toward Apple, Alphabet and Delta Air Lines might shape the stock from here.
Set out your own data backed case on Berkshire Hathaway’s valuation and drivers. Then track how it holds up as new results and developments around its AI focused investments and Warren Buffett’s planned share donations play out over time.
Do you think there's more to the story for Berkshire Hathaway? Head over to our Community to see what others are saying!
The Bottom Line
Berkshire Hathaway screens as undervalued on both the Excess Returns intrinsic value estimate and its P/E multiple, with those frameworks broadly pointing in the same direction. Together, they suggest the current share price does not fully reflect the earnings power implied by its equity base.
The crux for investors is whether Berkshire Hathaway can keep translating its concentrated mix of large technology, AI related holdings and core operating businesses into steady returns on equity without a setback that would justify the discount. The key debate from here is whether that discount is a genuine margin of safety or a sign the market is correctly pricing concentration and sector specific risk.
This article by Simply Wall St is general in nature. We provide commentary based on historical data and analyst forecasts only using an unbiased methodology and our articles are not intended to be financial advice. It does not constitute a recommendation to buy or sell any stock, and does not take account of your objectives, or your financial situation. We aim to bring you long-term focused analysis driven by fundamental data. Note that our analysis may not factor in the latest price-sensitive company announcements or qualitative material. Simply Wall St has no position in any stocks mentioned.
Have feedback on this article? Concerned about the content? Get in touch with us directly. Alternatively, email editorial-team@simplywallst.com