
Alliant Energy (LNT) Declares Dividend As Its Data Center Growth Story Shapes Valuation
Alliant Energy (LNT) drew investor attention after its board declared a quarterly cash dividend of $0.5350 per share, payable on August 17, 2026. This extends a streak of 323 consecutive quarterly payments since 1946.
See our latest analysis for Alliant Energy.
At a share price of $73.96, Alliant Energy has seen its recent momentum cool slightly, with a 1-day share price return down 1.15% and a 7-day share price return down 3.48%. However, the year-to-date share price return of 12.76% and 1-year total shareholder return of 18.15% indicate that the longer trend remains positive.
If this dividend update has you thinking more broadly about regulated utilities and infrastructure, it may be worth reviewing other power grid technology opportunities through the 33 power grid technology and infrastructure stocks
For Alliant Energy, the pullback after a strong 1-year total return presents a straightforward choice: lean into the current setup or wait for a lower entry. The valuation work comes next.
Most Popular Narrative: 6.5% Undervalued
Against the last close of $73.96, the most followed narrative pegs Alliant Energy’s fair value at $79.13, framing a modest valuation gap worth understanding.
The accelerating construction and onboarding of large-scale data centers in Alliant's Midwest service areas highlight a strong, sustained uptick in electricity demand, directly linked to population and economic growth in the region, which is expected to drive significant increases in revenue and top-line growth over the next several years. The company's adaptive resource planning and regulatory flexibility in Iowa and Wisconsin allows rapid deployment of new generation capacity, positioning Alliant to capture higher allowed returns and efficiently expand its regulated asset base, supporting long-term earnings growth and margin expansion.
There is a full earnings roadmap sitting behind that fair value for Alliant Energy. It hinges on steady revenue expansion, wider profit margins, and a future earnings multiple that assumes investors still pay up for this growth profile. Curious which assumptions move the needle most in that model and how they line up with today’s price? The narrative lays out the entire case in detail.
Result: Fair Value of $79.13 (UNDERVALUED)
Have a read of the narrative in full and understand what's behind the forecasts.
However, Alliant Energy’s thesis still leans on timely data center build outs and constructive Iowa and Wisconsin regulation, and setbacks on either front could quickly change the story.
Find out about the key risks to this Alliant Energy narrative.
Another View: Alliant Energy Through A Cash Flow Lens
The most followed Alliant Energy narrative leans on earnings and a future P/E of 21.7x to support fair value around $79.13. Our DCF model takes a stricter view, with an estimate of future cash flow value at $66.86 per share, which points to the stock trading above that level today.
Both approaches are looking at the same business, yet one suggests a modest upside while the other flags potential overvaluation. The gap largely comes down to how confidently you treat long dated data center growth and margin assumptions in your own cash flow view, so which side of that trade off do you find more convincing?
Look into how the SWS DCF model arrives at its fair value.
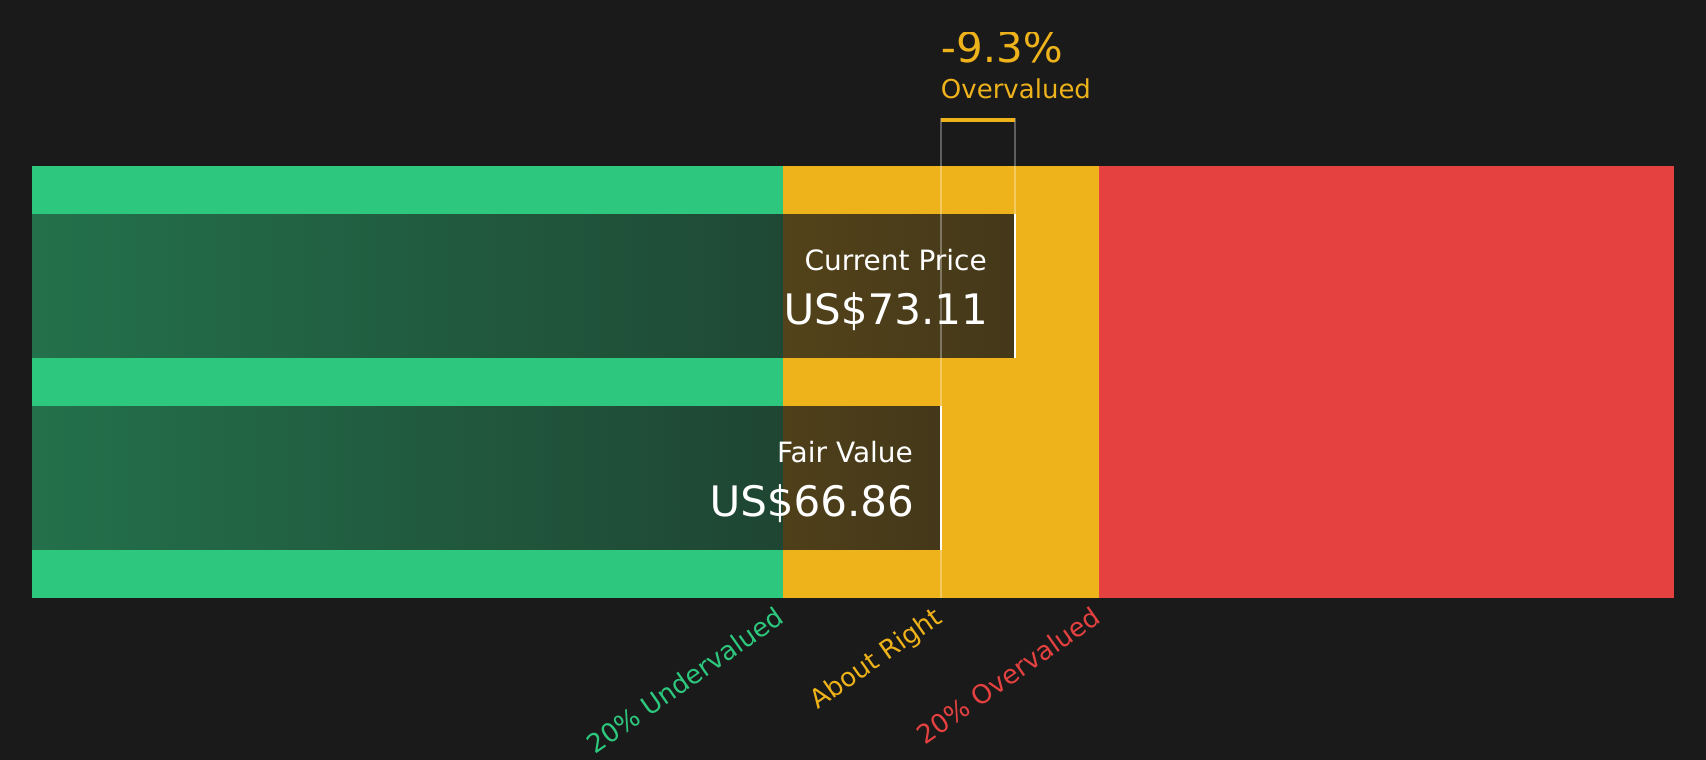
Simply Wall St performs a discounted cash flow (DCF) on every stock in the world every day (check out Alliant Energy for example). We show the entire calculation in full. You can track the result in your watchlist or portfolio and be alerted when this changes, or use our stock screener to discover 45 high quality undervalued stocks. If you save a screener we even alert you when new companies match - so you never miss a potential opportunity.
Next Steps
If the mixed signals around Alliant Energy leave you undecided, this is a good time to review the key data points yourself and then weigh the balance of risks and rewards highlighted in the 2 key rewards and 2 important warning signs
Looking for more investment ideas beyond Alliant Energy?
If Alliant Energy has sharpened your interest in utilities and income, do not stop here. Broader ideas across sectors can sharpen your portfolio decisions.
- Target resilient income by reviewing companies we flag as potential yield standouts through the 9 dividend fortresses.
- Hunt for quality at a discount by checking companies identified as potential value opportunities in the 45 high quality undervalued stocks.
- Prioritize capital preservation by focusing on companies that screen well on stability and risk through the 80 resilient stocks with low risk scores.
This article by Simply Wall St is general in nature. We provide commentary based on historical data and analyst forecasts only using an unbiased methodology and our articles are not intended to be financial advice. It does not constitute a recommendation to buy or sell any stock, and does not take account of your objectives, or your financial situation. We aim to bring you long-term focused analysis driven by fundamental data. Note that our analysis may not factor in the latest price-sensitive company announcements or qualitative material. Simply Wall St has no position in any stocks mentioned.
Have feedback on this article? Concerned about the content? Get in touch with us directly. Alternatively, email editorial-team@simplywallst.com