
Fabrinet (FN) Falls 17% In A Month, Is It Cheap Or Fully Valued?
Fabrinet (FN) has drawn investor attention after recent trading saw the stock fall 2.6% in one day and decline about 16.8% over the past month, despite a strong longer term track record.
See our latest analysis for Fabrinet.
At a share price of $513.67, Fabrinet’s 1 day share price return of 2.59% and 30 day share price return of 16.76% suggest momentum has cooled recently. However, the 1 year total shareholder return of 68.31% highlights how strong longer term returns have been.
If Fabrinet’s recent swings have you thinking about portfolio balance, this could be a good moment to widen your search with 54 AI infrastructure stocks
After Fabrinet’s sharp pullback, the stock now sits at a sizeable discount to analyst targets, yet the implied intrinsic value points the other way. Is the market merely cautious, or is it flagging real concerns about valuation?
Most Popular Narrative: 19.1% Undervalued
With Fabrinet trading at $513.67 against a widely followed fair value narrative of $635, the gap reflects growth expectations that investors are weighing carefully.
Structural customer concentration risk remains unchanged, with more than 45 percent of revenue dependent on just two customers (NVIDIA and Cisco). This persistent reliance increases volatility and makes Fabrinet vulnerable to major revenue setbacks or margin compression if even a single key customer brings business in-house, chooses another outsourcing partner, or reduces order volumes due to their own cycle or supply chain strategies.
Here is the tension: rich growth and margin assumptions on one side, meaningful customer concentration on the other. Curious which detailed revenue, earnings and valuation inputs tip the scales in this fair value story.
Result: Fair Value of $635 (UNDERVALUED)
Have a read of the narrative in full and understand what's behind the forecasts.
However, Fabrinet’s fair value story could be challenged if high customer concentration or rising labor and compliance costs begin to weigh more heavily on margins.
Find out about the key risks to this Fabrinet narrative.
Another View on Fabrinet’s Valuation
The fair value story for Fabrinet so far leans on growth assumptions and analyst targets, yet our DCF model points in a different direction, with the stock trading above an estimated future cash flow value of $317.37. That suggests less upside from cash generation, so which signal should carry more weight for you?
To understand how this cash flow based view is built and where the sensitivities sit, take a closer look at the SWS DCF model: Look into how the SWS DCF model arrives at its fair value.
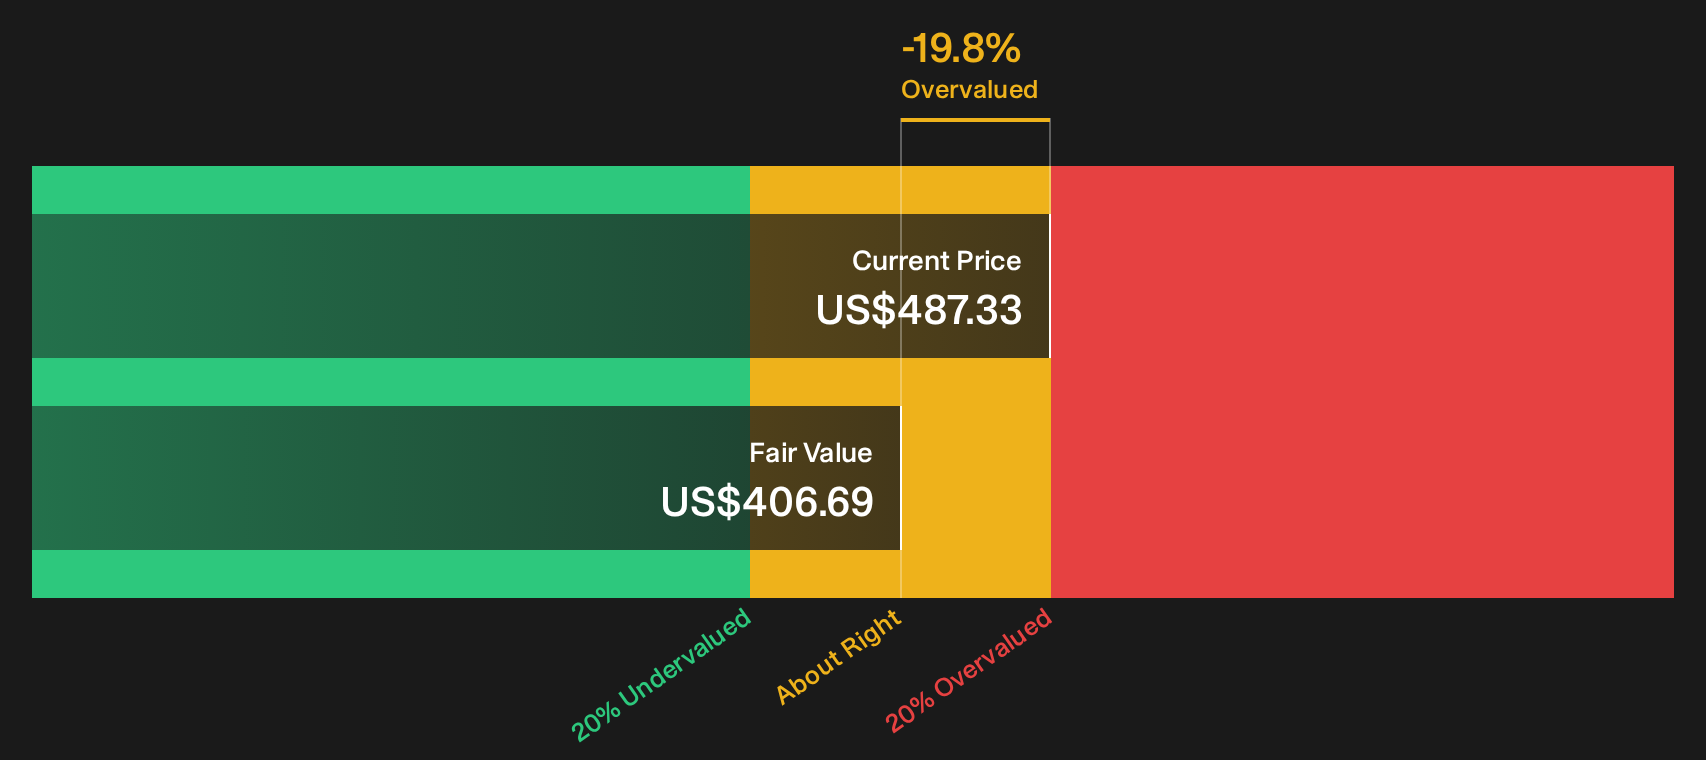
Simply Wall St performs a discounted cash flow (DCF) on every stock in the world every day (check out Fabrinet for example). We show the entire calculation in full. You can track the result in your watchlist or portfolio and be alerted when this changes, or use our stock screener to discover 47 high quality undervalued stocks. If you save a screener we even alert you when new companies match - so you never miss a potential opportunity.
Next Steps
With Fabrinet presenting both potential upside and clear areas of concern, this is a moment to act quickly and test the numbers yourself using 3 key rewards and 3 important warning signs.
Looking for more investment ideas beyond Fabrinet?
If Fabrinet has sharpened your focus on quality opportunities, do not stop here. Broaden your watchlist now with carefully filtered stocks tailored to different goals.
- Target potential mispricing by reviewing companies that pass strict quality and valuation filters using the 47 high quality undervalued stocks.
- Prioritize resilient cash flows and income reliability by scanning for established payers through the 7 dividend fortresses.
- Focus on stability and downside protection by assessing companies highlighted in the 82 resilient stocks with low risk scores.
This article by Simply Wall St is general in nature. We provide commentary based on historical data and analyst forecasts only using an unbiased methodology and our articles are not intended to be financial advice. It does not constitute a recommendation to buy or sell any stock, and does not take account of your objectives, or your financial situation. We aim to bring you long-term focused analysis driven by fundamental data. Note that our analysis may not factor in the latest price-sensitive company announcements or qualitative material. Simply Wall St has no position in any stocks mentioned.
Have feedback on this article? Concerned about the content? Get in touch with us directly. Alternatively, email editorial-team@simplywallst.com