
Asian Market Stocks Possibly Priced Below Intrinsic Value
Amid a backdrop of volatility in global markets, Asian stocks have faced mixed performances with technology sectors experiencing significant declines. However, this environment may present opportunities for investors to identify stocks that are potentially undervalued relative to their intrinsic value. In such conditions, a good stock is often characterized by strong fundamentals and the potential for growth despite broader market challenges.
Top 10 Undervalued Stocks Based On Cash Flows In Asia
| Name | Current Price | Fair Value (Est) | Discount (Est) |
| SHIFT (TSE:3697) | ¥745.80 | ¥1491.41 | 50% |
| Seojin SystemLtd (KOSDAQ:A178320) | ₩42500.00 | ₩84641.78 | 49.8% |
| Samyang Foods (KOSE:A003230) | ₩1127000.00 | ₩2214803.55 | 49.1% |
| Rakuten Bank (TSE:5838) | ¥5714.00 | ¥11167.01 | 48.8% |
| Pan-United (SGX:P52) | SGD1.62 | SGD3.16 | 48.7% |
| NC Chem (KOSDAQ:A482630) | ₩13170.00 | ₩25761.68 | 48.9% |
| Moshi Moshi Retail Corporation (SET:MOSHI) | THB39.25 | THB76.63 | 48.8% |
| Matrix Design (SZSE:301365) | CN¥36.80 | CN¥73.26 | 49.8% |
| Loncin Motor (SHSE:603766) | CN¥13.77 | CN¥27.01 | 49% |
| Info-Tech Systems (SGX:ITS) | SGD0.98 | SGD1.94 | 49.5% |
Let's take a closer look at a couple of our picks from the screened companies.
Seojin SystemLtd (KOSDAQ:A178320)
Overview: Seojin System Co., Ltd is a company that provides telecom equipment, repeaters, mechanical products, and LED and other equipment, with a market cap of ₩2.70 billion.
Operations: The company's revenue segments include telecom equipment, repeaters, mechanical products, and LED and other equipment.
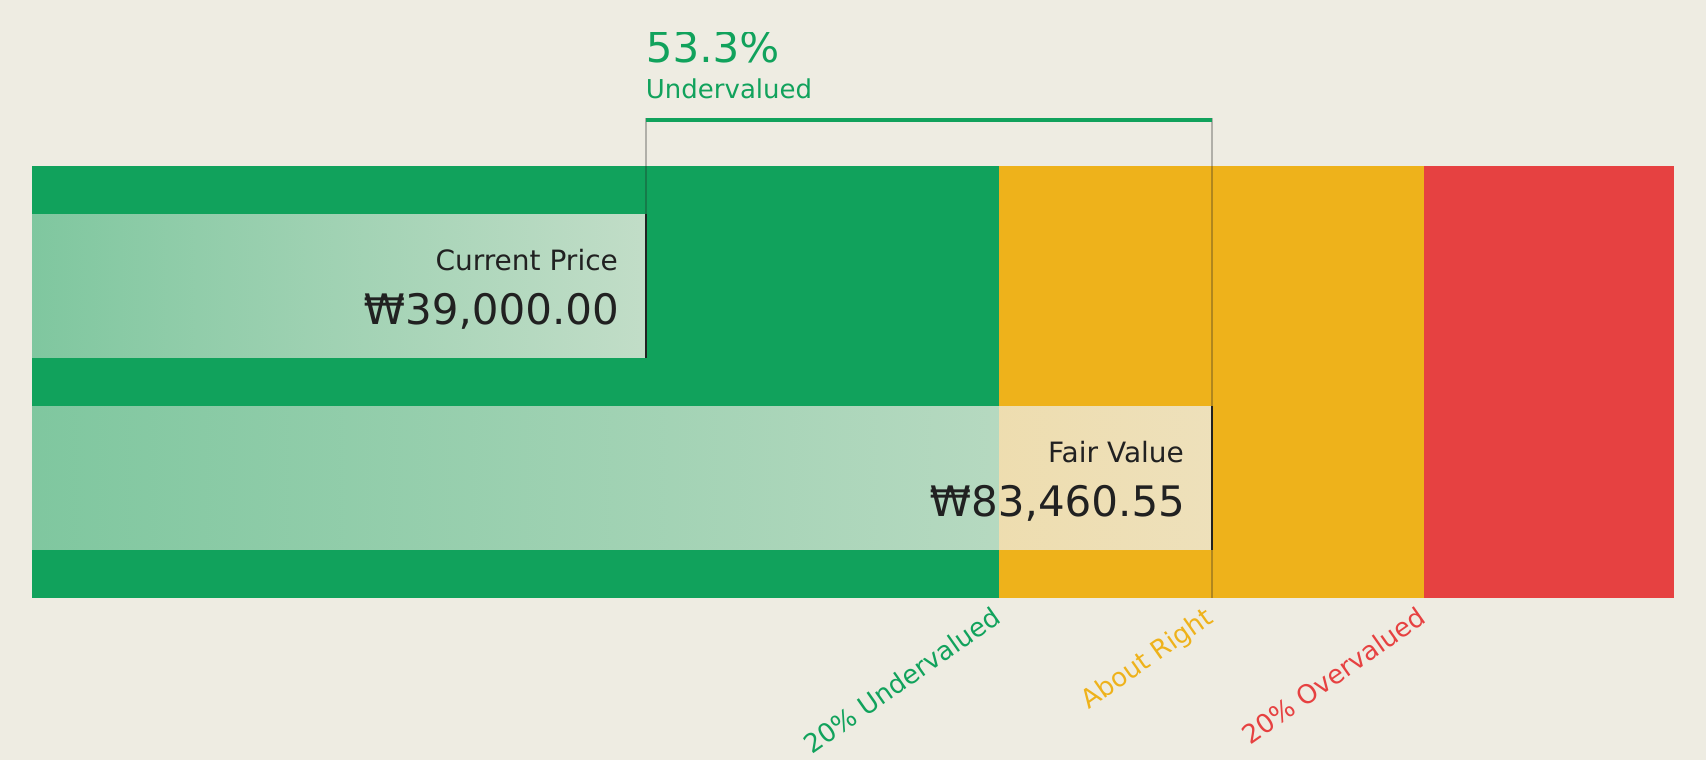
Estimated Discount To Fair Value: 49.8%
Seojin System Ltd. is trading at ₩42,500, significantly below its estimated future cash flow value of ₩84,641.78, indicating a strong undervaluation based on cash flows. Despite high share price volatility recently, the company is expected to become profitable within three years with earnings projected to grow very large annually. However, operating cash flow does not adequately cover debt obligations. Recent acquisition by Stick Sequoia Holdings valued shares at ₩51,700 each further underscores potential value recognition.
- The growth report we've compiled suggests that Seojin SystemLtd's future prospects could be on the up.
- Click here to discover the nuances of Seojin SystemLtd with our detailed financial health report.
GCS Holdings (TPEX:4991)
Overview: GCS Holdings, Inc. and its subsidiaries manufacture and sell compound semiconductor wafers and provide foundry-related services in China, the United States, Taiwan, and internationally, with a market cap of NT$52.73 billion.
Operations: The company generates revenue of NT$2.44 billion from its semiconductor equipment and services segment.
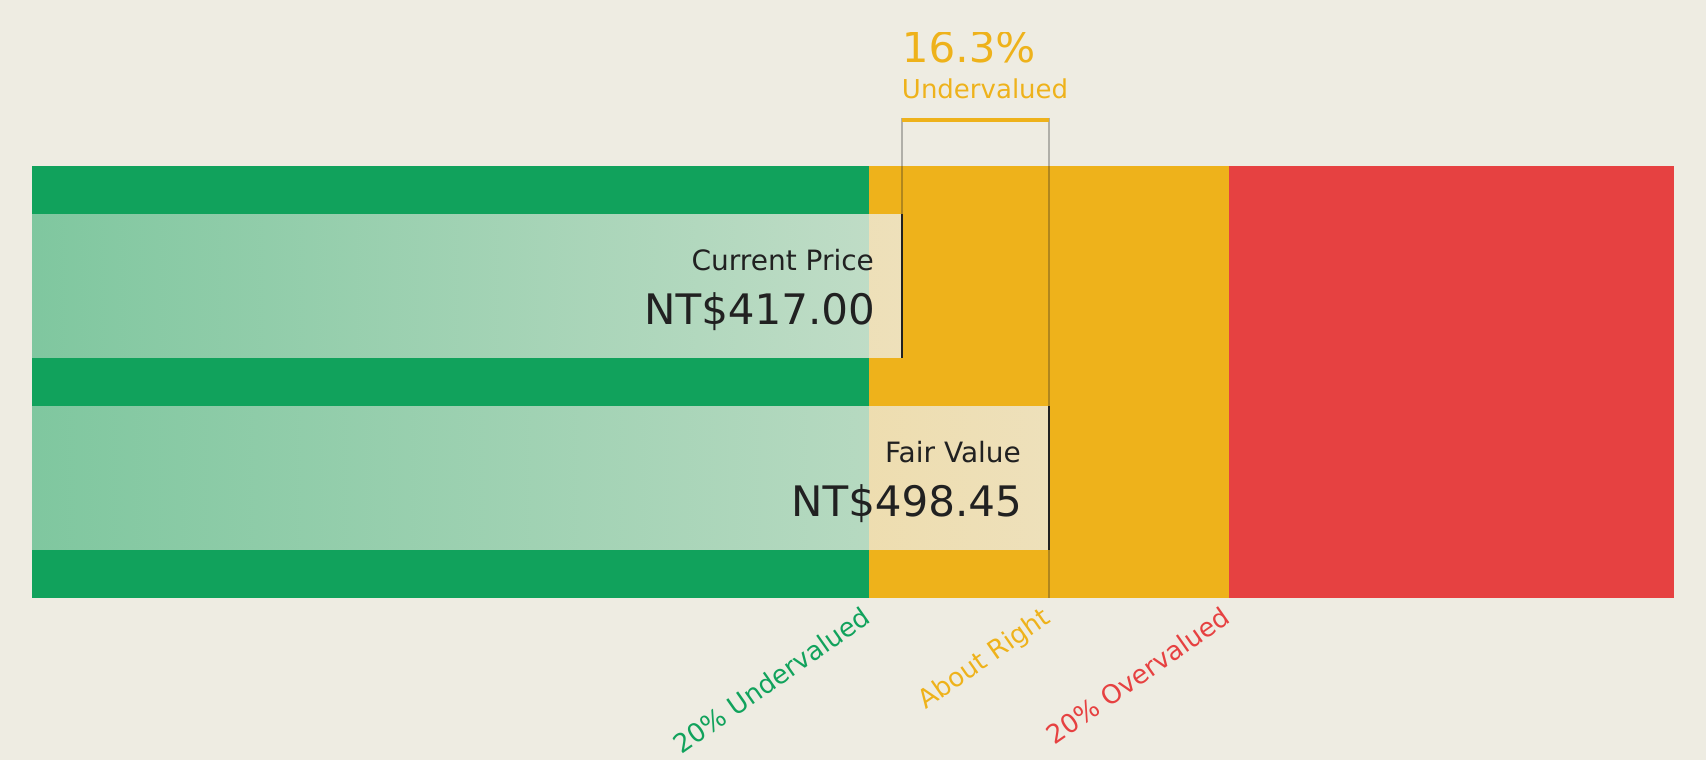
Estimated Discount To Fair Value: 12.4%
GCS Holdings trades at NT$436, below its estimated cash flow value of NT$497.49, suggesting undervaluation. Despite high share price volatility, revenue and earnings are forecast to grow significantly faster than the Taiwan market at 35.8% and 78.8% per year, respectively. The company became profitable this year with Q1 2026 sales reaching TWD 714.68 million and net income of TWD 196.09 million, reversing a prior loss position from last year’s comparable period.
- The analysis detailed in our GCS Holdings growth report hints at robust future financial performance.
- Navigate through the intricacies of GCS Holdings with our comprehensive financial health report here.
EZconn (TWSE:6442)
Overview: EZconn Corporation, along with its subsidiaries, is involved in the assembly, processing, and trading of precision metal parts for electronic components and optical fiber components, with a market cap of NT$108.24 billion.
Operations: The company's revenue primarily comes from its Optical Fiber Component segment, generating NT$10.20 billion, and High Frequency Connectors, contributing NT$925.36 million.
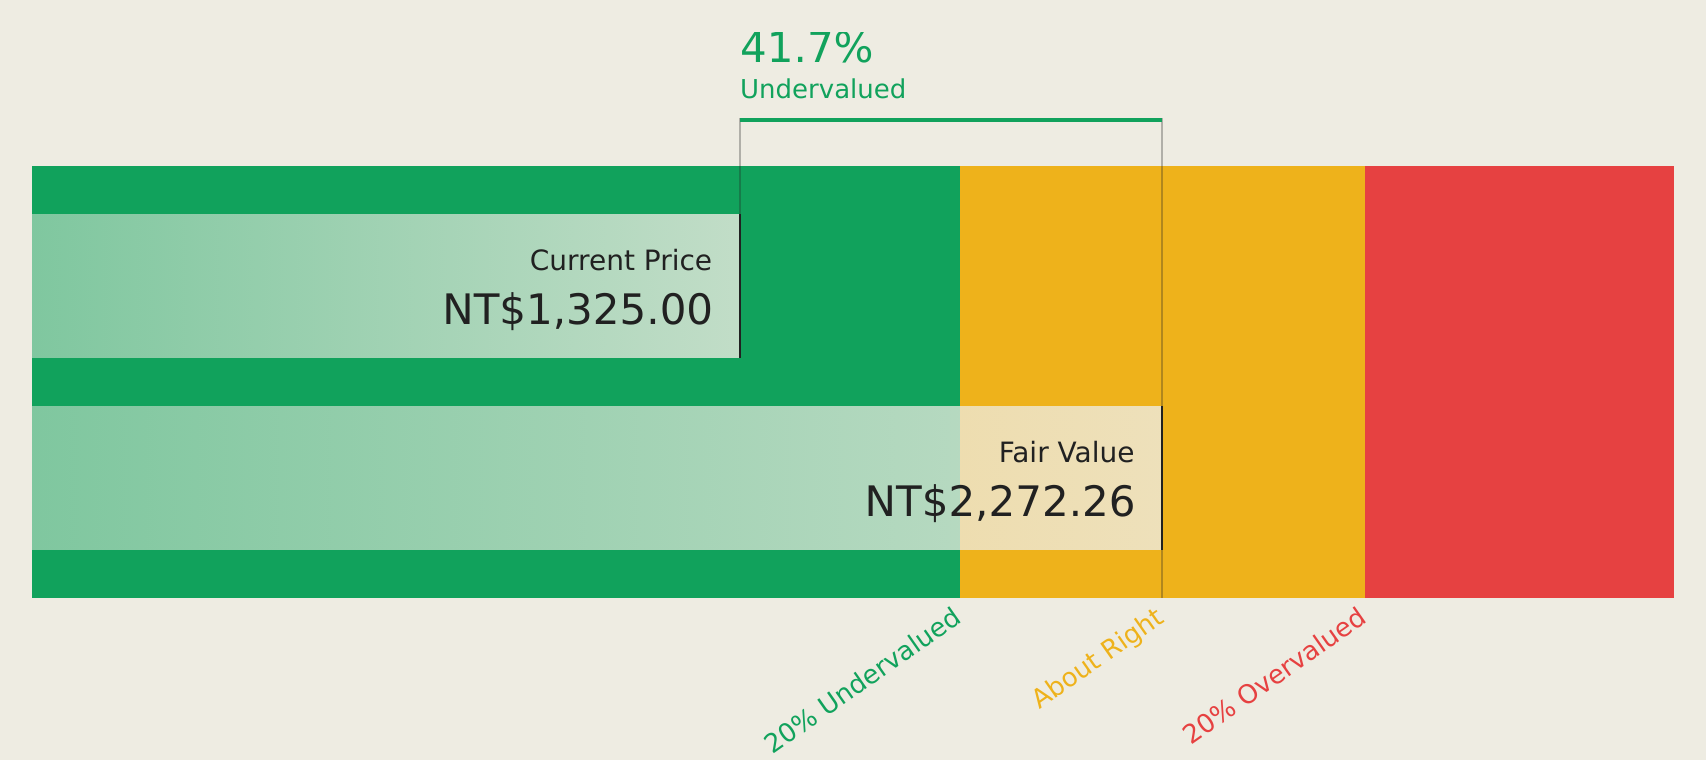
Estimated Discount To Fair Value: 38.6%
EZconn trades at NT$1,390, significantly below its estimated future cash flow value of NT$2,263.78. Despite recent share price volatility and a follow-on equity offering in May 2026, the company's earnings and revenue are forecast to grow at 82.2% and 66.7% annually over the next three years, outpacing Taiwan's market averages. Q1 2026 results showed strong performance with sales of TWD 2.71 billion and net income of TWD 606.76 million compared to last year’s figures.
- Our growth report here indicates EZconn may be poised for an improving outlook.
- Click here and access our complete balance sheet health report to understand the dynamics of EZconn.
Summing It All Up
- Gain an insight into the universe of 209 Undervalued Asian Stocks Based On Cash Flows by clicking here.
- Already own these companies? Link your portfolio to Simply Wall St and get alerts on any new warning signs to your stocks.
- Maximize your investment potential with Simply Wall St, the comprehensive app that offers global market insights for free.
Seeking Other Investments?
- Explore high-performing small cap companies that haven't yet garnered significant analyst attention.
- Diversify your portfolio with solid dividend payers offering reliable income streams to weather potential market turbulence.
- Fuel your portfolio with companies showing strong growth potential, backed by optimistic outlooks both from analysts and management.
This article by Simply Wall St is general in nature. We provide commentary based on historical data and analyst forecasts only using an unbiased methodology and our articles are not intended to be financial advice. It does not constitute a recommendation to buy or sell any stock, and does not take account of your objectives, or your financial situation. We aim to bring you long-term focused analysis driven by fundamental data. Note that our analysis may not factor in the latest price-sensitive company announcements or qualitative material. Simply Wall St has no position in any stocks mentioned.
Have feedback on this article? Concerned about the content? Get in touch with us directly. Alternatively, email editorial-team@simplywallst.com