
Terreno Realty (TRNO) Lease Momentum Keeps Valuation In Focus
Terreno Realty (TRNO) is back in focus after a series of industrial lease announcements, including early renewals and expansions in New York and California that extend occupancy commitments well into the next decade.
See our latest analysis for Terreno Realty.
Recent lease wins in New York and California come as Terreno Realty’s share price sits at $72.68, with a 30-day share price return of 11.06% and a 1-year total shareholder return of 31.83%. This suggests momentum has been building over both shorter and longer horizons as investors reassess potential growth and risk around its industrial portfolio.
If these industrial deals have your attention and you want to see what else could be on your radar, now is a good time to broaden your search and uncover 35 power grid technology and infrastructure stocks
Terreno Realty’s leasing wins and strong recent share price run paint a solid business picture, but the real test is whether that optimism is already fully reflected in today’s US$72.68 price or not.
Price-to-Earnings of 18.3x: Is it justified?
On a P/E basis, Terreno Realty trades on 18.3x earnings, which sits slightly below the broader US market but above the global Industrial REITs peer group.
The P/E ratio compares the company’s current share price to its earnings per share and is often used to gauge how much investors are willing to pay for each dollar of profit. For an industrial REIT like Terreno Realty, it can reflect expectations around rental income durability, balance sheet strength and how reliably earnings can support its 2.86% dividend yield.
Here, the signals are mixed. Terreno Realty is flagged as expensive relative to the global Industrial REITs industry average of 16x, which implies investors are paying a premium compared to sector peers. At the same time, its 18.3x P/E is below the peer average of 33.8x and below the US market multiple of 19.1x, and a fair P/E of 24.8x suggests the market could move toward a higher valuation level if conditions align with that estimate.
That contrast is important, because it means Terreno Realty looks more expensive than typical Industrial REITs globally, yet cheaper than its closer peer set and below the estimated fair ratio that regression work points to as a potential reference level.
Explore the SWS fair ratio for Terreno Realty
Result: Price-to-Earnings of 18.3x (ABOUT RIGHT)
However, Terreno Realty’s narrative could be challenged if its early lease restructurings pressure near term earnings, or if valuation assumptions around its fair P/E prove too optimistic.
Find out about the key risks to this Terreno Realty narrative.
Another View: Terreno Realty Through a Cash Flow Lens
While Terreno Realty looks roughly in line on its 18.3x P/E, the SWS DCF model suggests a different story, with an estimated future cash flow value of $66.47 versus today’s $72.68 share price. That gap points to possible overvaluation, so which signal do you weigh more heavily?
Look into how the SWS DCF model arrives at its fair value.
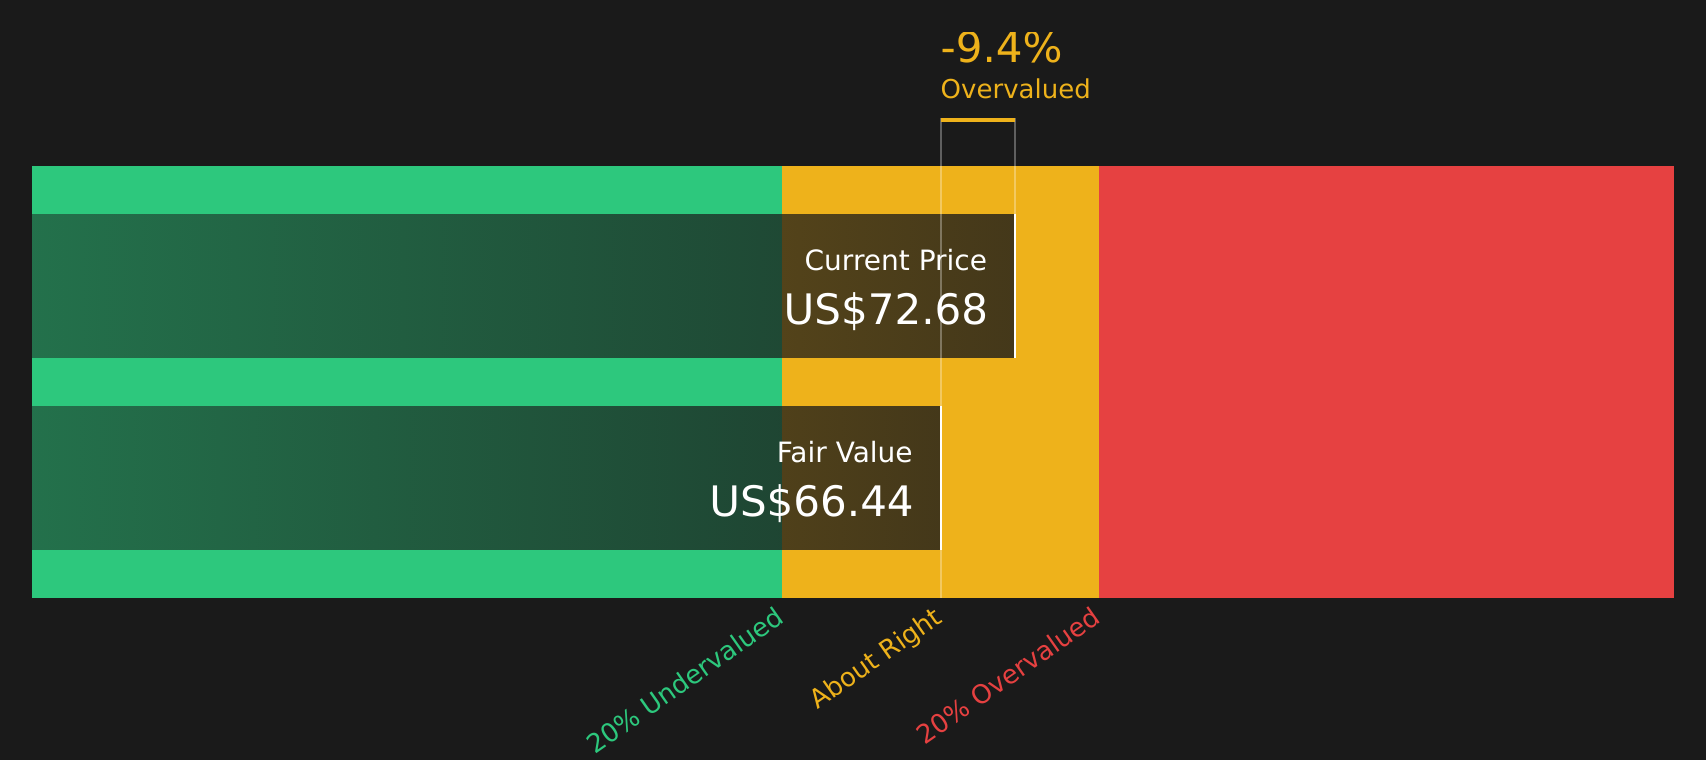
Simply Wall St performs a discounted cash flow (DCF) on every stock in the world every day (check out Terreno Realty for example). We show the entire calculation in full. You can track the result in your watchlist or portfolio and be alerted when this changes, or use our stock screener to discover 49 high quality undervalued stocks. If you save a screener we even alert you when new companies match - so you never miss a potential opportunity.
Next Steps
If this mix of optimism and concern around Terreno Realty leaves you on the fence, now is the moment to look through the data yourself and decide what stands out most for your portfolio, then weigh the balance of risks and rewards with the 3 key rewards and 2 important warning signs
Looking for more ideas beyond Terreno Realty?
If Terreno Realty has sharpened your appetite for opportunities, do not stop here. Use the Simply Wall St screener to surface fresh ideas that fit your style.
- Spot potential mispricings early and review 49 high quality undervalued stocks that may offer a different balance of quality and price than Terreno Realty.
- Prioritise resilience and examine 81 resilient stocks with low risk scores that might suit a more defensive corner of your portfolio.
- Get ahead of the crowd and track a screener containing 20 high quality undiscovered gems before they appear on everyone else's radar.
This article by Simply Wall St is general in nature. We provide commentary based on historical data and analyst forecasts only using an unbiased methodology and our articles are not intended to be financial advice. It does not constitute a recommendation to buy or sell any stock, and does not take account of your objectives, or your financial situation. We aim to bring you long-term focused analysis driven by fundamental data. Note that our analysis may not factor in the latest price-sensitive company announcements or qualitative material. Simply Wall St has no position in any stocks mentioned.
Have feedback on this article? Concerned about the content? Get in touch with us directly. Alternatively, email editorial-team@simplywallst.com