
Baker Hughes (BKR) Stock Looks Reasonable On Earnings But Cheap On Cash Flow
Baker Hughes stock has delivered a strong 209.3% return over the past 5 years, yet current checks suggest the market price may still sit below an intrinsic value estimate built from a Discounted Cash Flow (DCF) model.
- A 209.3% 5 year return indicates that Baker Hughes has already rewarded long term holders, so any valuation upside now matters more for new capital coming in.
- Record bookings, a larger portfolio following the Chart Industries acquisition, and new contracts such as the Angola subsea project can support expectations for future cash flows. At the same time, the extra debt funding for the deal and exposure to oil and gas activity may limit how much investors are willing to pay for that growth.
- The stock screens as undervalued across the broader checks, with 6 of 6 tests suggesting the current price looks cheap rather than stretched.
The question now is whether Baker Hughes' recent run and deal activity are already reflected in the share price, or if the discount to intrinsic value still leaves room for further upside.
Find out why Baker Hughes' 25.1% return over the last year is lagging behind its peers.
Does Baker Hughes Look Undervalued on Cash Flow?
The Discounted Cash Flow (DCF) approach estimates what Baker Hughes could be worth today based on the cash it is expected to generate in the future.
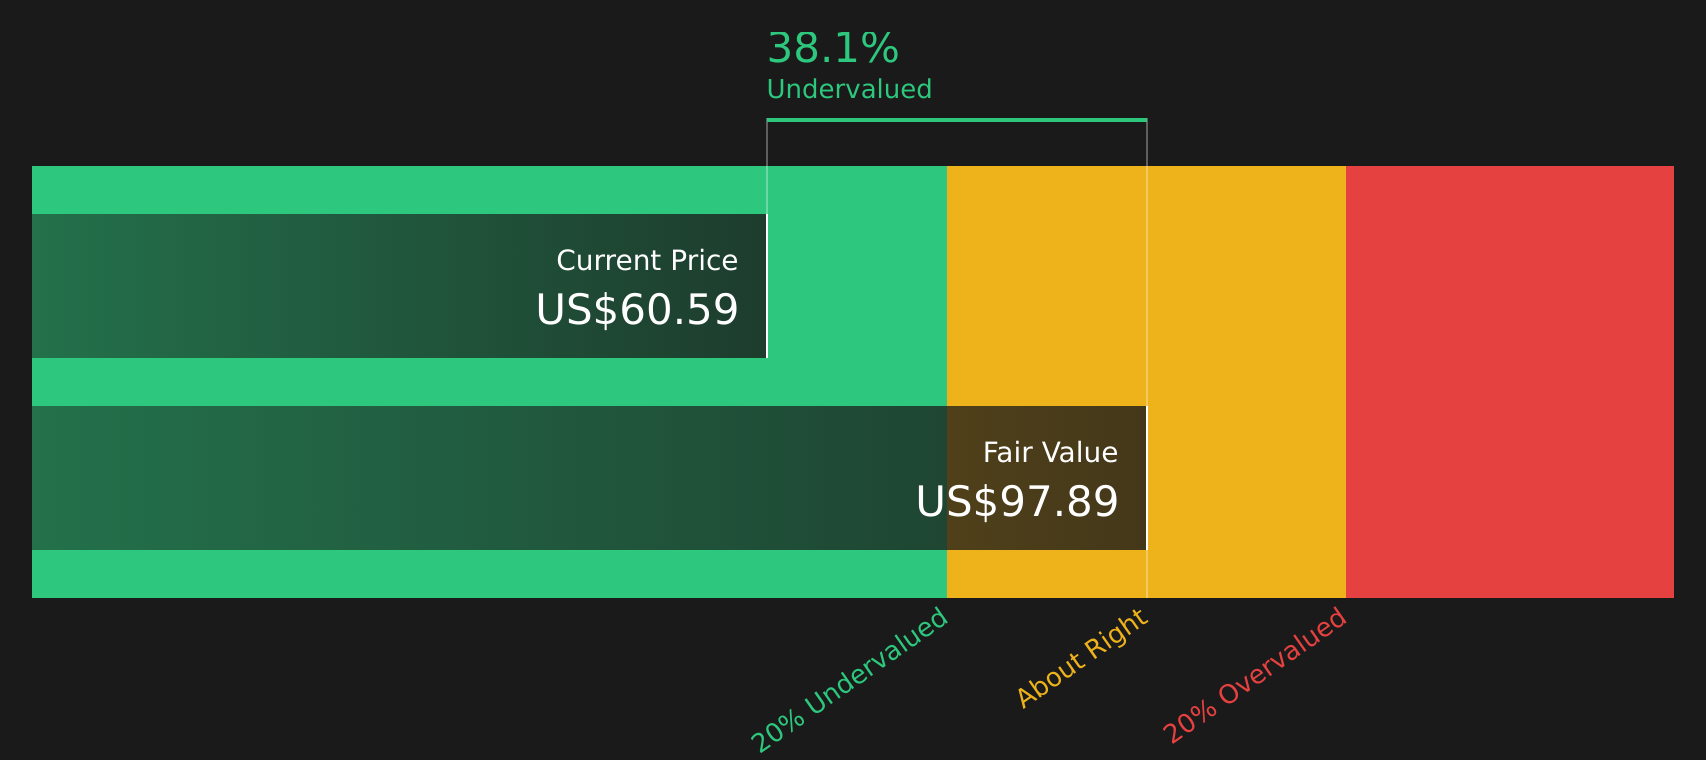
The model uses latest twelve month free cash flow of about $2.3b and assumes that Baker Hughes' cash flows continue growing rather than shrinking over time. On these assumptions, the 2 Stage Free Cash Flow to Equity model points to an intrinsic value of about $88.69 per share. This implies the stock screens around 35.4% undervalued versus the current market price.
Because Baker Hughes reported record Q2 2026 orders and completed the Chart Industries acquisition, the Discounted Cash Flow (DCF) result suggests the market is still applying a cautious price even as projected cash flows reflect these developments.
On this cash flow view, Baker Hughes stock currently appears undervalued relative to the intrinsic value implied by the DCF model.
Our Discounted Cash Flow (DCF) analysis suggests Baker Hughes is undervalued by 35.4%. Track this in your watchlist or portfolio, or discover 50 more high quality undervalued stocks.
Is Baker Hughes Fairly Priced on Earnings?
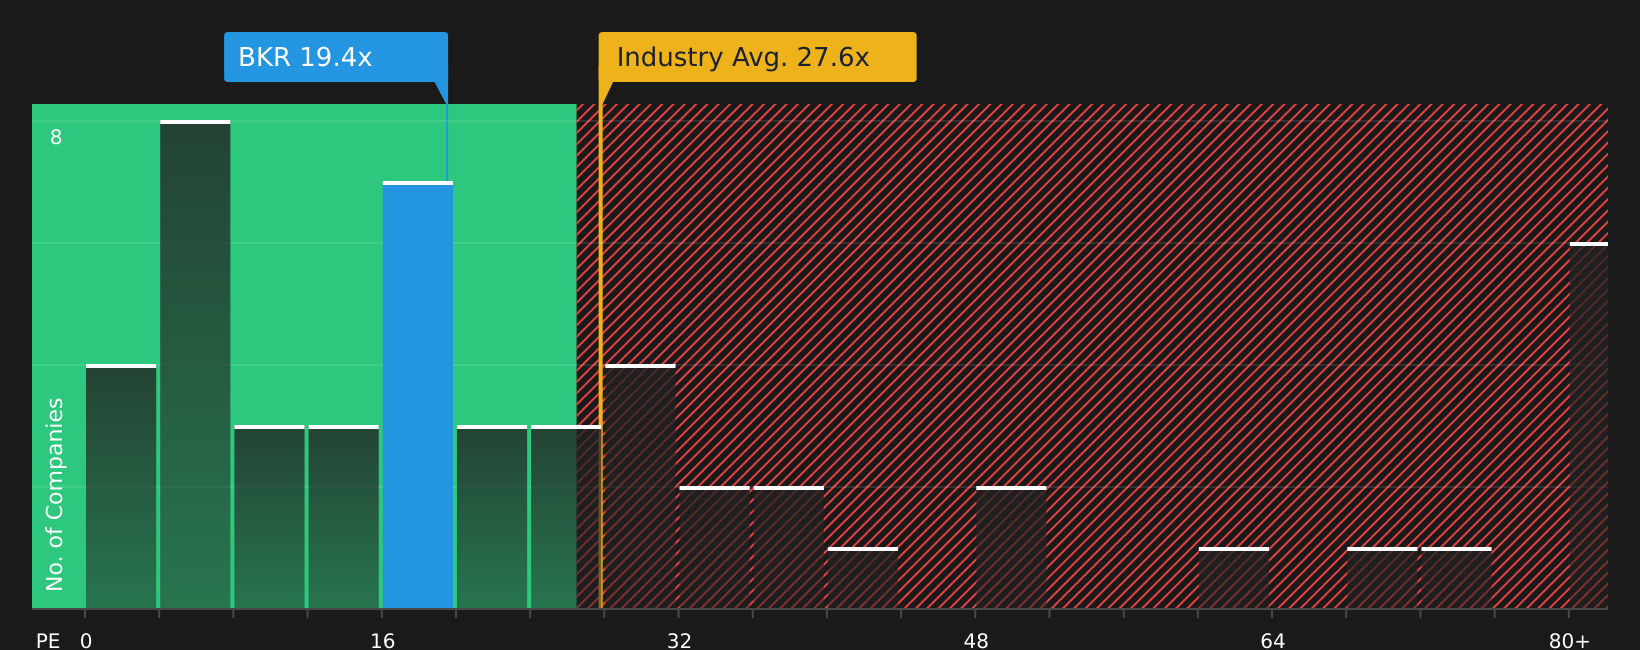
The P/E ratio suits Baker Hughes because earnings remain a key reference point for how the market is weighing its energy services and equipment mix. The stock trades on a P/E of about 18.2x, which is below the Energy Services industry average of roughly 28.3x and also under the peer group average of about 38.1x. That alone points to a discount, even before layering in recent news around record orders and the Chart Industries acquisition.
A more tailored yardstick that blends Baker Hughes' earnings profile, scale and risk suggests a fair P/E of about 19.9x. Against this, the current 18.2x multiple is slightly lower, indicating the stock is pricing in a modest margin of safety rather than a premium. For investors, that indicates the earnings multiple does not look stretched, but it also is not implying a deep bargain relative to what the fair ratio model suggests.
Overall, Baker Hughes appears priced roughly in line with what its earnings profile would justify on a P/E basis.
See what the numbers say about this price — find out in our valuation breakdown.
The Baker Hughes Narrative: What Would Justify Today's Price?
Simply Wall St Narratives for Baker Hughes link the earlier valuation work to clear, testable stories about what would need to happen with the company’s growth, margins and earnings for the stock to be worth materially more or less than today’s price. These narratives are available on Simply Wall St’s Community page.
Each one treats Baker Hughes' fair value as a thesis about the business that you can watch over time, rather than a single static estimate.
Community views on Baker Hughes are split between a multi year backlog story and concern that current contracts and risks already set the bar high.
Bull case: 33% undervalued
"Record IET orders of US$4.9b in the quarter, a 25% rise in IET orders over the last 4 quarters to US$16.6b and an RPO of US$33.1b support multi year revenue visibility and give a foundation for earnings resilience as this backlog converts…"
Read the full Bull Case to see why Baker Hughes could be undervalued
Bear case: 7% overvalued
"Heavy concentration of current growth on LNG and gas infrastructure projects, such as large QatarEnergy contracts and the San Matias Pipeline, leaves future revenue exposed if project approvals, maintenance schedules or export flows slow…"
Read the full Bear Case to see why Baker Hughes could be overvalued
Do you think there's more to the story for Baker Hughes? Head over to our Community to see what others are saying!
The Bottom Line
For Baker Hughes, the Discounted Cash Flow (DCF) view points to material undervaluation, while the earnings multiple suggests the stock is now priced about right rather than as a clear bargain. Taken together, the broader checks lean supportive, but not in a way that removes the need to weigh the risks around energy exposure, deal funding and execution. The central issue for investors is whether Baker Hughes can turn its current backlog and new contracts into durable cash flows without eroding returns through capital intensity or balance sheet strain. This will influence whether the current discount represents an opportunity or a value trap.
This article by Simply Wall St is general in nature. We provide commentary based on historical data and analyst forecasts only using an unbiased methodology and our articles are not intended to be financial advice. It does not constitute a recommendation to buy or sell any stock, and does not take account of your objectives, or your financial situation. We aim to bring you long-term focused analysis driven by fundamental data. Note that our analysis may not factor in the latest price-sensitive company announcements or qualitative material. Simply Wall St has no position in any stocks mentioned.
Have feedback on this article? Concerned about the content? Get in touch with us directly. Alternatively, email editorial-team@simplywallst.com