
3 European Dividend Stocks With Yields Up To 6.1%
The European market has recently shown resilience, with the pan-European STOXX Europe 600 Index posting gains amid robust corporate earnings and geopolitical tensions. In this environment, dividend stocks can offer a stable income stream, making them an attractive option for investors seeking to navigate market volatility while benefiting from potential capital appreciation.
Top 10 Dividend Stocks In Europe
| Name | Dividend Yield | Dividend Rating |
| Zurich Insurance Group (SWX:ZURN) | 4.07% | ★★★★★★ |
| Teleperformance (ENXTPA:TEP) | 7.86% | ★★★★★★ |
| Telekom Austria (WBAG:TKA) | 4.20% | ★★★★★★ |
| Swiss Re (SWX:SREN) | 4.80% | ★★★★★★ |
| Rubis (ENXTPA:RUI) | 6.33% | ★★★★★★ |
| Hannover Rück (XTRA:HNR1) | 4.86% | ★★★★★★ |
| Edel SE KGaA (XTRA:EDL) | 6.20% | ★★★★★★ |
| Cembra Money Bank (SWX:CMBN) | 5.06% | ★★★★★★ |
| Bouygues (ENXTPA:EN) | 4.47% | ★★★★★☆ |
| Banque Cantonale Vaudoise (SWX:BCVN) | 3.44% | ★★★★★☆ |
Click here to see the full list of 205 stocks from our Top European Dividend Stocks screener.
Let's review some notable picks from our screened stocks.
Procimmo Group (BRSE:SEGN)
Simply Wall St Dividend Rating: ★★★★☆☆
Overview: Procimmo Group AG is a Swiss holding company focused on the investment, management, and sale of real estate properties, with a market capitalization of CHF423.42 million.
Operations: Procimmo Group AG generates revenue primarily from its Real Estate & Property Managers segment, amounting to CHF54.79 million.
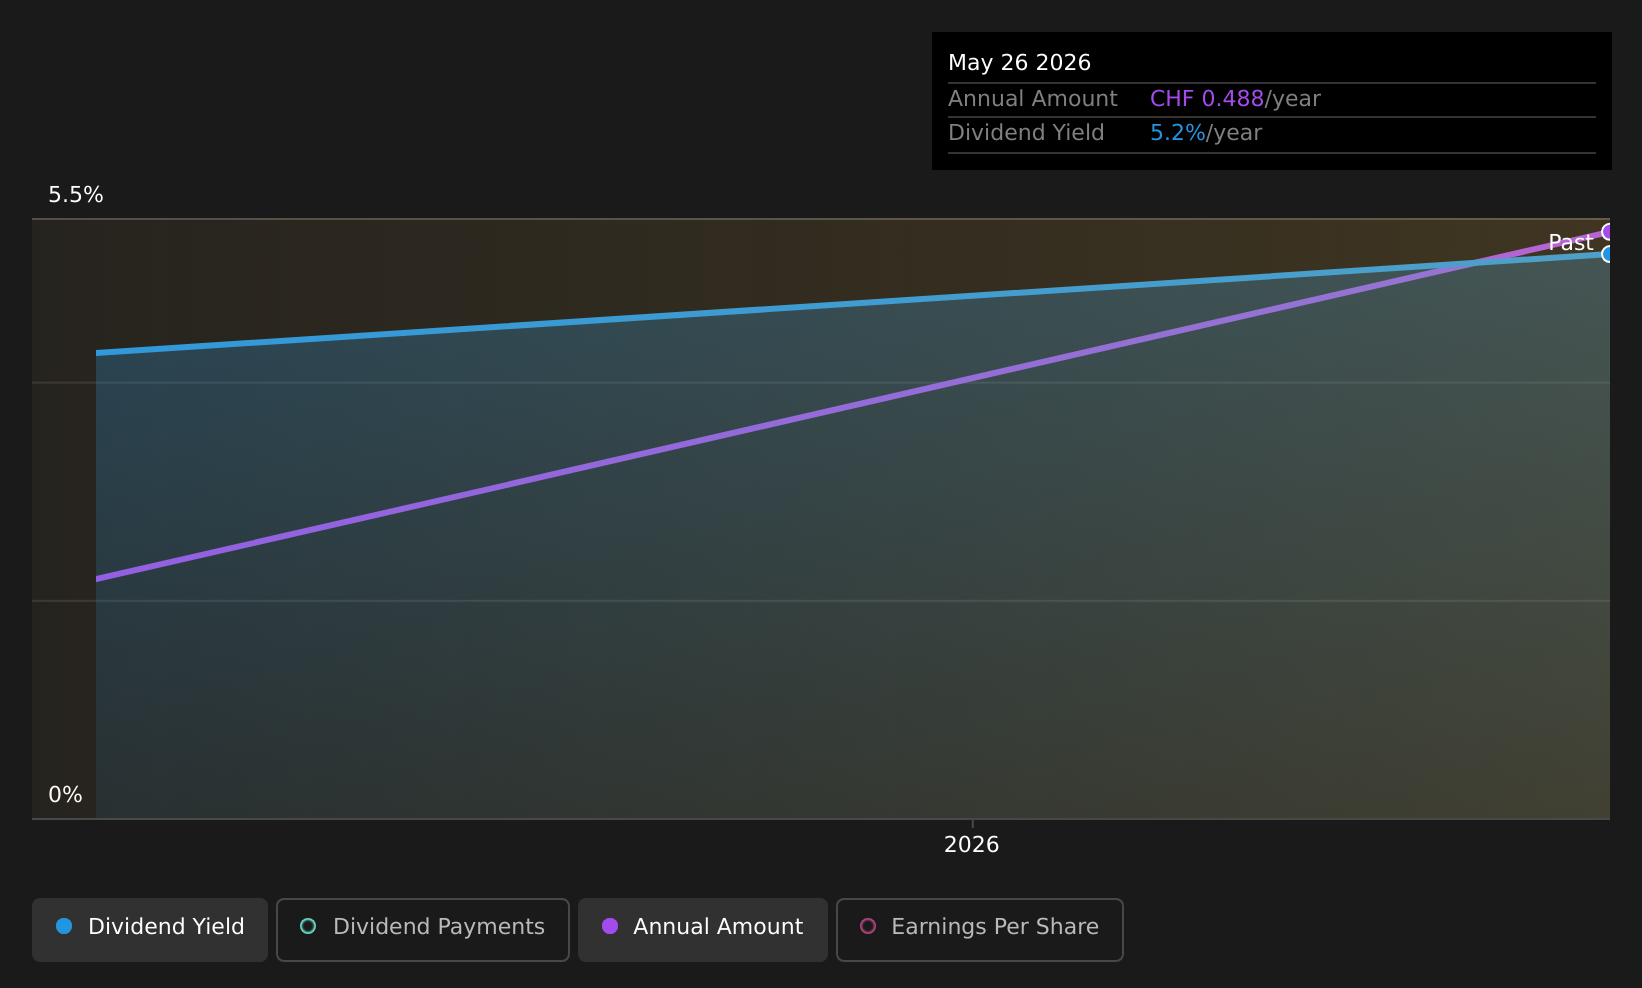
Dividend Yield: 5.2%
Procimmo Group AG offers a compelling dividend profile with a payout ratio of 58.8%, ensuring dividends are covered by earnings, and cash flows further support this with a 69.8% cash payout ratio. The company has increased its annual dividend to CHF 0.4885 per share, reflecting growth despite having paid dividends for only seven years. However, the stock's high debt level and illiquidity may pose risks, while recent acquisition developments might impact future stability and shareholder structure.
- Click here and access our complete dividend analysis report to understand the dynamics of Procimmo Group.
- The analysis detailed in our Procimmo Group valuation report hints at an deflated share price compared to its estimated value.
Rainbow Tours (WSE:RBW)
Simply Wall St Dividend Rating: ★★★★☆☆
Overview: Rainbow Tours S.A. is a Polish tour operator with a market capitalization of PLN2.02 billion.
Operations: Rainbow Tours S.A.'s revenue primarily comes from its Tour Operator Activities in Poland, which generated PLN4.34 billion, complemented by its Hotel Segment abroad with PLN97.33 million.
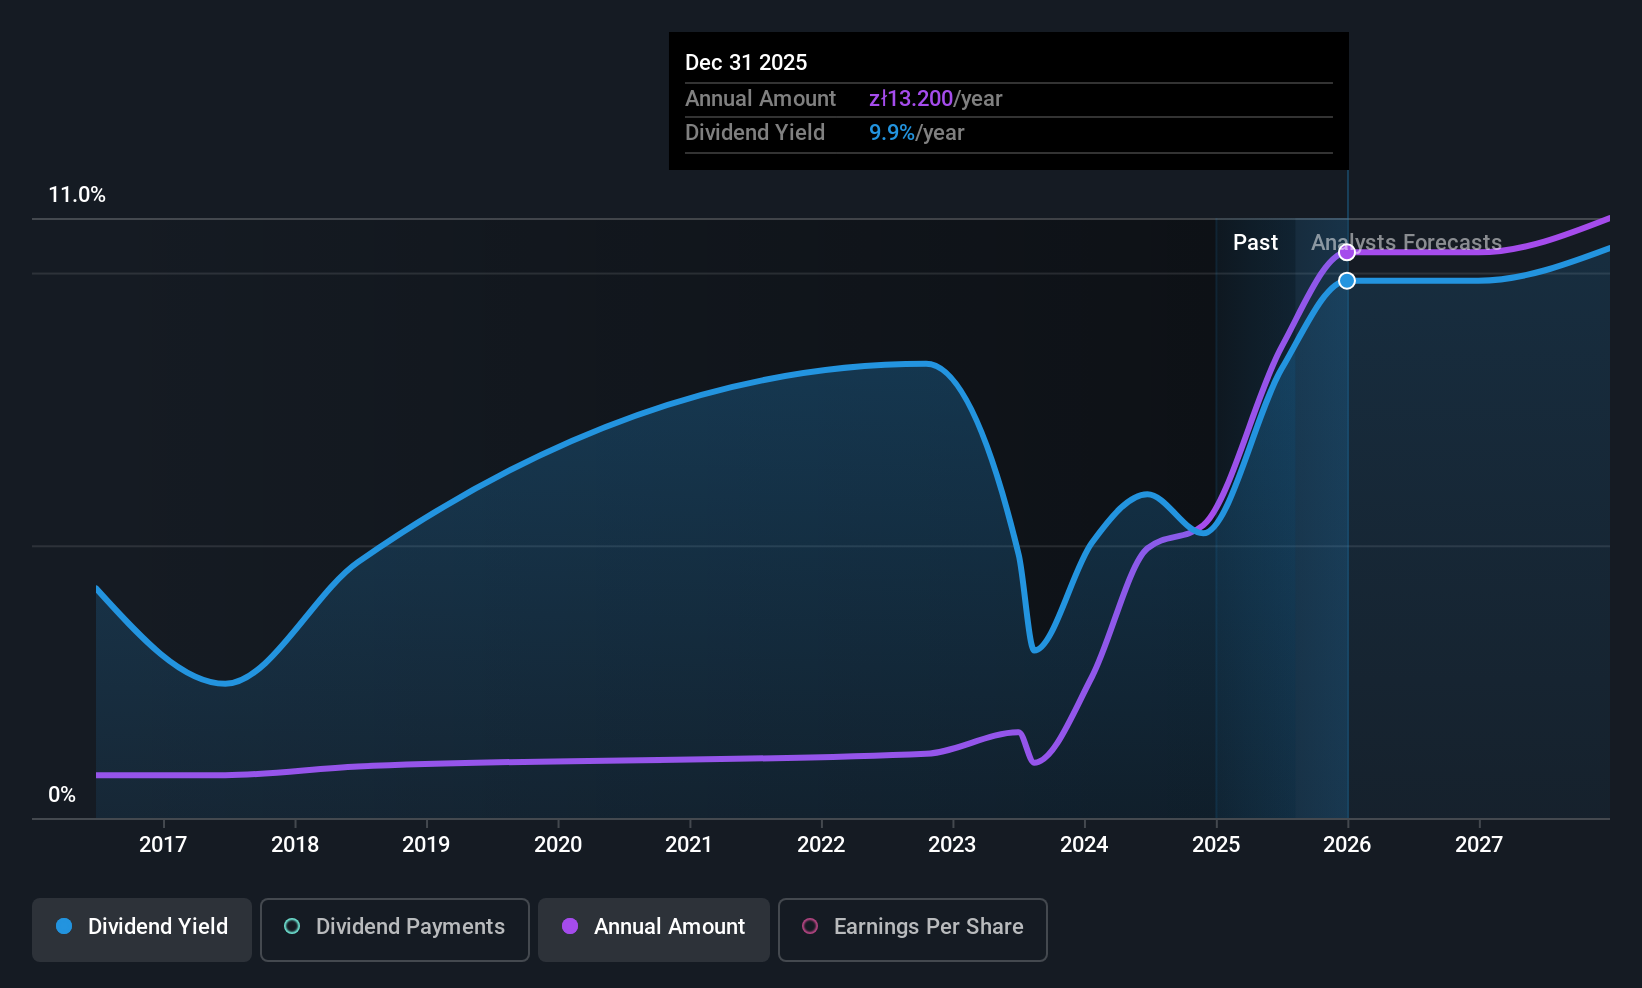
Dividend Yield: 6.2%
Rainbow Tours' dividend profile is mixed, with a payout ratio of 51% supported by earnings and a cash payout ratio of 61.8%. Despite past volatility and unreliability, dividends have grown over the last decade. The current yield of 6.2% lags behind Poland's top dividend payers. Trading at a favorable price-to-earnings ratio of 8.2x, recent earnings fell short year-over-year despite increased sales, highlighting potential challenges in sustaining future dividends amidst forecasted earnings declines.
- Get an in-depth perspective on Rainbow Tours' performance by reading our dividend report here.
- In light of our recent valuation report, it seems possible that Rainbow Tours is trading behind its estimated value.
Mensch und Maschine Software (XTRA:MUM)
Simply Wall St Dividend Rating: ★★★★☆☆
Overview: Mensch und Maschine Software SE offers technical software and digitization solutions in areas such as computer-aided design, manufacturing, engineering, product data and lifecycle management, and building information modeling and management, with a market cap of €605.12 million.
Operations: Mensch und Maschine Software SE generates revenue through its offerings in computer-aided design, manufacturing, engineering solutions, product data and lifecycle management, and building information modeling and management.
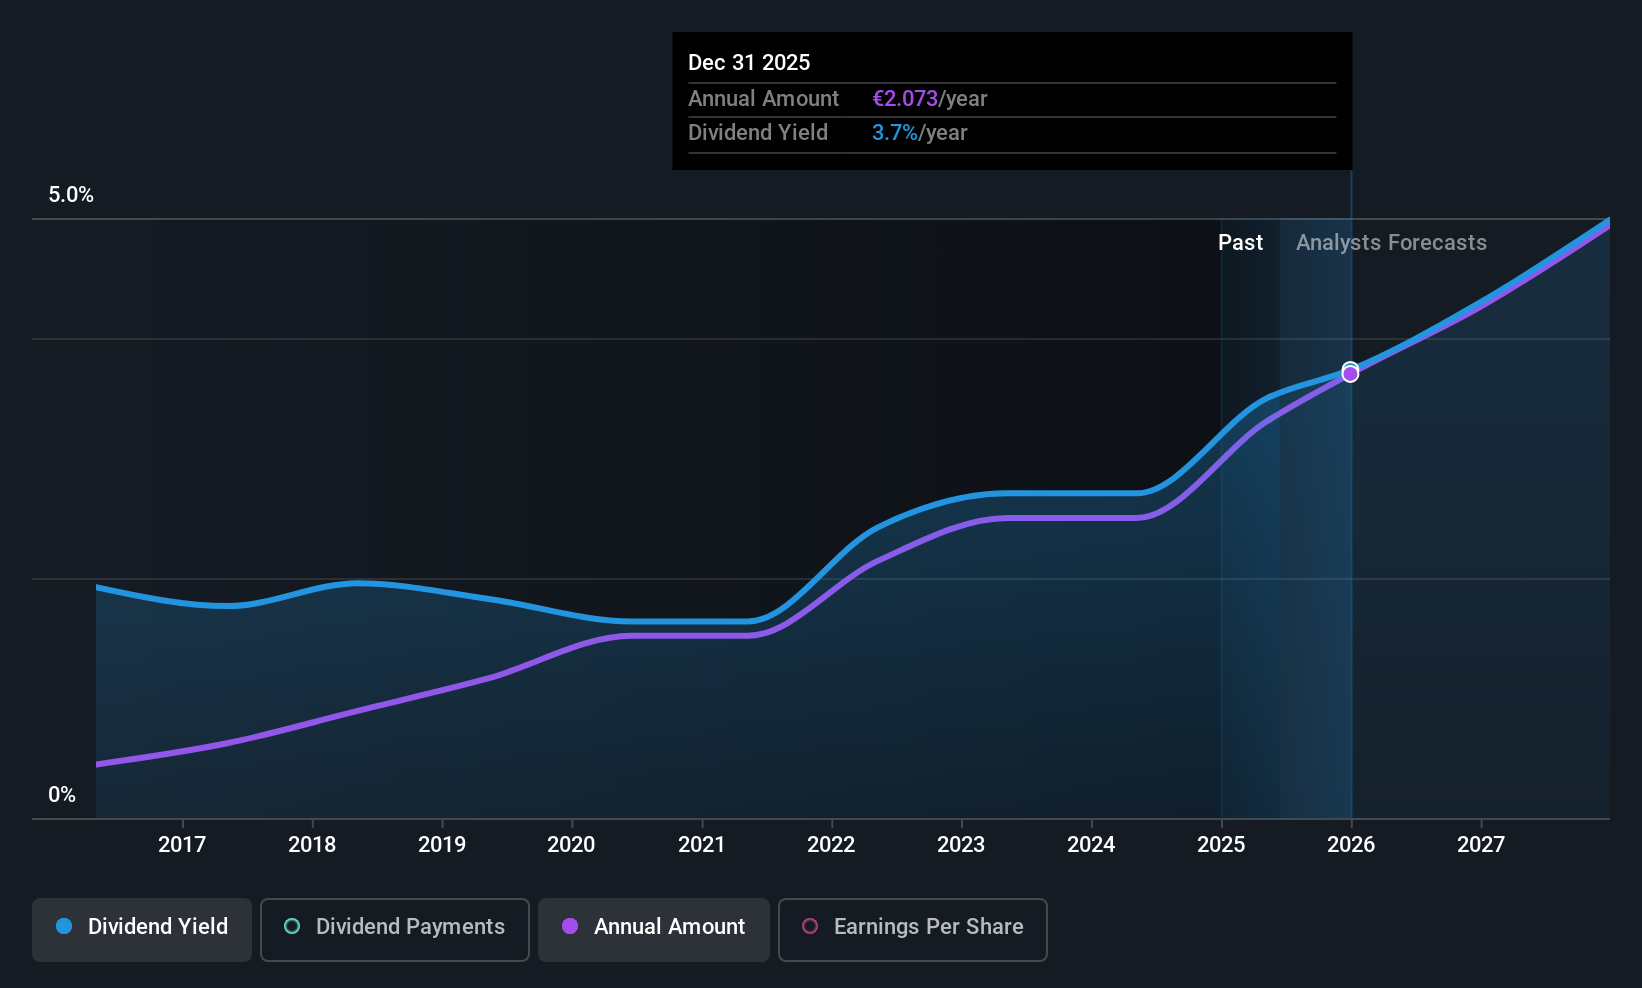
Dividend Yield: 5.4%
Mensch und Maschine Software's dividend yield of 5.44% ranks in the top 25% in Germany, yet its sustainability is questionable due to a payout ratio of 102.1% and a cash payout ratio of 183.1%, indicating dividends exceed earnings and cash flows. Despite stable and growing dividends over the past decade, recent earnings showed mixed results with increased sales but decreased quarterly net income, raising concerns about future dividend reliability amidst forecasted earnings growth.
- Dive into the specifics of Mensch und Maschine Software here with our thorough dividend report.
- The valuation report we've compiled suggests that Mensch und Maschine Software's current price could be quite moderate.
Next Steps
- Get an in-depth perspective on all 205 Top European Dividend Stocks by using our screener here.
- Are these companies part of your investment strategy? Use Simply Wall St to consolidate your holdings into a portfolio and gain insights with our comprehensive analysis tools.
- Join a community of smart investors by using Simply Wall St. It's free and delivers expert-level analysis on worldwide markets.
Want To Explore Some Alternatives?
- Explore high-performing small cap companies that haven't yet garnered significant analyst attention.
- Fuel your portfolio with companies showing strong growth potential, backed by optimistic outlooks both from analysts and management.
- Find companies with promising cash flow potential yet trading below their fair value.
This article by Simply Wall St is general in nature. We provide commentary based on historical data and analyst forecasts only using an unbiased methodology and our articles are not intended to be financial advice. It does not constitute a recommendation to buy or sell any stock, and does not take account of your objectives, or your financial situation. We aim to bring you long-term focused analysis driven by fundamental data. Note that our analysis may not factor in the latest price-sensitive company announcements or qualitative material. Simply Wall St has no position in any stocks mentioned.
Have feedback on this article? Concerned about the content? Get in touch with us directly. Alternatively, email editorial-team@simplywallst.com