
Is St. Joe (JOE) Fairly Valued As Fresh Results Highlight A Big DCF Gap?
St. Joe (JOE) just reported its second quarter 2026 results, giving investors fresh data on revenue, earnings and capital returns. The update also included a quarterly dividend declaration and progress on a long running share repurchase program.
See our latest analysis for St. Joe.
St. Joe shares trade at $62.24, with the stock posting a 4.06% year to date share price return and a 26.13% total shareholder return over the past year. This points to momentum building as investors react to record quarterly results, active buybacks and the ongoing dividend stream.
If you are weighing St. Joe alongside other real asset and infrastructure plays, it can help to scan a wider field of stocks using our 35 power grid technology and infrastructure stocks
After a record quarter, richer dividend and long running buyback, the share price has already moved a long way. For St. Joe at $62.24, is the stronger case that most of the upside sits ahead, or already in the rearview mirror as valuation comes into focus next?
Discounted cash flow suggests a large valuation gap
On Simply Wall St’s DCF model, St. Joe has an estimated future cash flow value of $149.53 per share, compared with the latest close at $62.24. That implies the stock is trading at a sizeable discount to this estimate.
The SWS DCF model projects the cash St. Joe might generate in future years and then discounts those cash flows back to today using a required rate of return. The result is an estimate of what those future streams could be worth in today’s dollars.
For a real estate development and hospitality business with multiple income sources, a cash flow based view can give a different angle than earnings alone. It also captures market expectations around how sustainably St. Joe can convert its mix of residential, hospitality and commercial assets into cash over time.
Look into how the SWS DCF model arrives at its fair value.
Result: DCF Fair value of $149.53 (UNDERVALUED)
However, St. Joe’s real estate and hospitality focus leaves it exposed to shifts in property demand and tourism trends, which could challenge cash flow assumptions.
Find out about the key risks to this St. Joe narrative.
Another view on St. Joe using market multiples
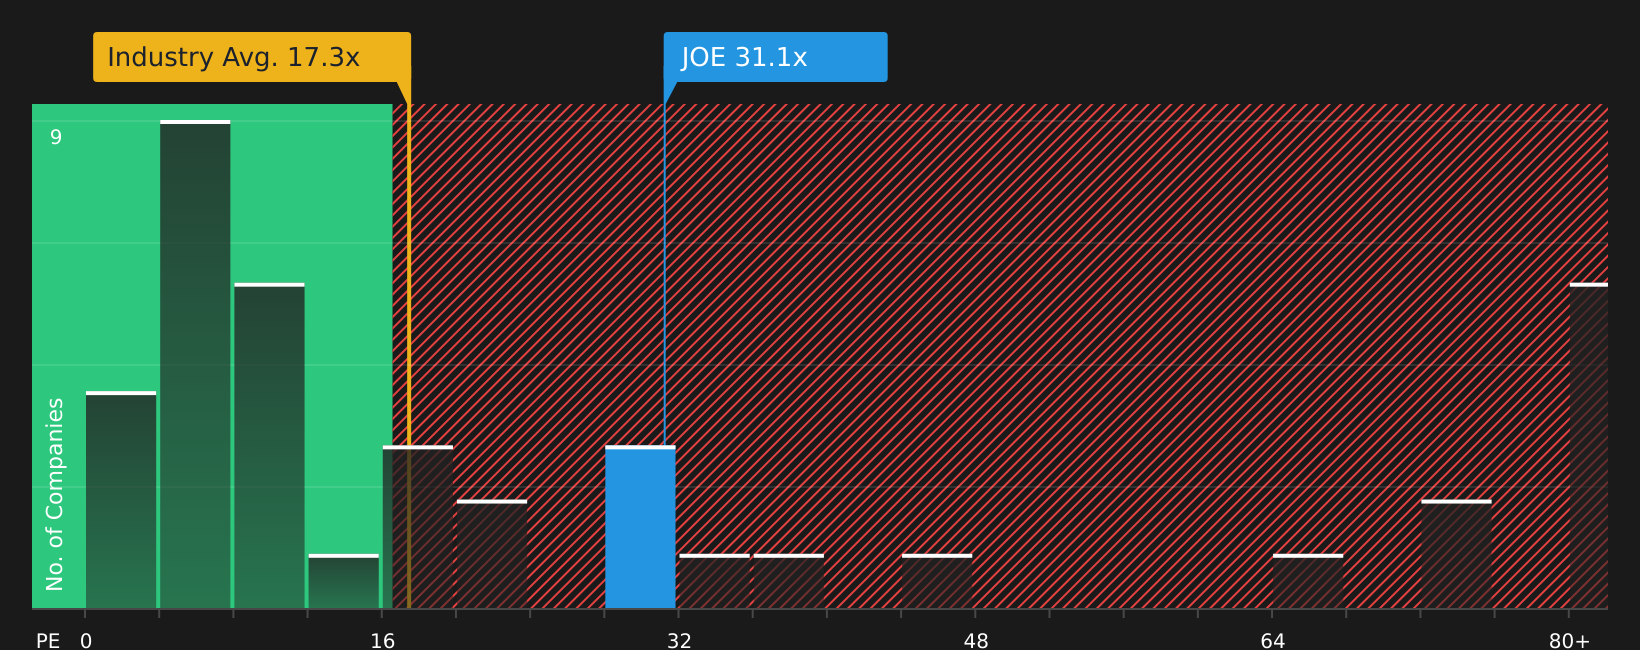
While the SWS DCF model points to a large gap between St. Joe's share price and its estimated future cash flow value, the market is telling a different story. On a P/E of 28.8x, St. Joe trades well above both the US Real Estate industry average of 19.9x and a peer average of 12.3x.
That kind of premium suggests investors are already paying up for the company's earnings. It can signal confidence, but it also reduces the margin for error if growth or profitability slows. The question for you is whether the current earnings and business mix justify paying a higher multiple than both the sector and peers.
See what the numbers say about this price — find out in our valuation breakdown.
Simply Wall St performs a discounted cash flow (DCF) on every stock in the world every day (check out St. Joe for example). We show the entire calculation in full. You can track the result in your watchlist or portfolio and be alerted when this changes, or use our stock screener to discover 55 high quality undervalued stocks. If you save a screener we even alert you when new companies match - so you never miss a potential opportunity.
Next Steps
Seen enough to sense that the St. Joe story is not one sided, with both risks and rewards in play? Move quickly, review the latest data points yourself, and then check the 2 key rewards and 1 important warning sign
Looking for more investment ideas beyond St. Joe?
If St. Joe has sharpened your focus, now is the time to widen your scope with fresh stock ideas sourced directly from the Simply Wall St screener.
- Target potential mispricings by scanning 55 high quality undervalued stocks that combine quality fundamentals with prices that may not fully reflect their underlying businesses.
- Strengthen your income stream by reviewing 9 dividend fortresses that pair higher yields with a focus on durability and consistency.
- Sleep easier at night by assessing 81 resilient stocks with low risk scores that score well on resilience and balance sheet strength so you are not overexposed to fragile stories.
This article by Simply Wall St is general in nature. We provide commentary based on historical data and analyst forecasts only using an unbiased methodology and our articles are not intended to be financial advice. It does not constitute a recommendation to buy or sell any stock, and does not take account of your objectives, or your financial situation. We aim to bring you long-term focused analysis driven by fundamental data. Note that our analysis may not factor in the latest price-sensitive company announcements or qualitative material. Simply Wall St has no position in any stocks mentioned.
Have feedback on this article? Concerned about the content? Get in touch with us directly. Alternatively, email editorial-team@simplywallst.com