
Aisin (TSE:7259) Reported Mixed Q1 Earnings, Is It Still Below Fair Value?
Aisin (TSE:7259) is back in focus after its Q1 2027 earnings call on July 31, 2026, reporting sales of ¥1,315,603 million, along with lower net income and basic earnings per share year over year.
See our latest analysis for Aisin.
Aisin's latest results landed after a tough stretch for the stock, with the share price down 28% year to date and 9.02% over 90 days, even as the 5 year total shareholder return of 78.42% still reflects a much stronger long term outcome.
If this earnings update has you reassessing the auto sector, it could be a good moment to broaden your watchlist with 36 robotics and automation stocks
Aisin now trades well below recent levels, even after years of strong total returns. This sets up a clear tension: is the bigger share price move already in the rearview mirror, or does today’s discount still leave meaningful upside on the table?
Preferred P/E Multiple of 9.3x: Is it justified?
The latest data puts Aisin on a P/E of 9.3x, which screens as inexpensive compared to both peers and the broader JP Auto Components industry.
The P/E ratio links Aisin's current share price of ¥2,163 to its earnings per share. It reflects how much investors are paying for each unit of current profit. For an auto parts business where profitability can be cyclical, the P/E is a simple way to see how the market is weighing those earnings today.
Here, the numbers are clear. Aisin is flagged as trading at good value compared to peers and industry, with the P/E of 9.3x well below the peer average of 26x. It is also described as good value compared to the estimated fair P/E of 14.5x, which implies the market could move closer to that level if sentiment and earnings expectations line up over time.
On top of that, Aisin's P/E of 9.3x is slightly below the JP Auto Components industry average of 9.7x. This reinforces the impression that the stock is priced more conservatively than many sector peers despite forecasts for earnings to grow each year.
Explore the SWS fair ratio for Aisin
Result: Price-to-earnings of 9.3x (UNDERVALUED)
However, Aisin still faces risks if auto demand softens further or if profitability comes under pressure in key regions such as Japan, North America, or China.
Find out about the key risks to this Aisin narrative.
Another View on Aisin Using the SWS DCF Model
The first check on Aisin focused on its 9.3x P/E, which screens as inexpensive. A different lens tells a stronger story. Our DCF model puts Aisin's future cash flow value at ¥5,803.62 per share versus the current ¥2,163 price, suggesting the stock screens as undervalued on this measure too.
DCF models rely on long term cash flow assumptions, while the P/E is anchored to current earnings. When both point to value, the key question for you is which signal you trust more if company or sector conditions change.
Look into how the SWS DCF model arrives at its fair value.
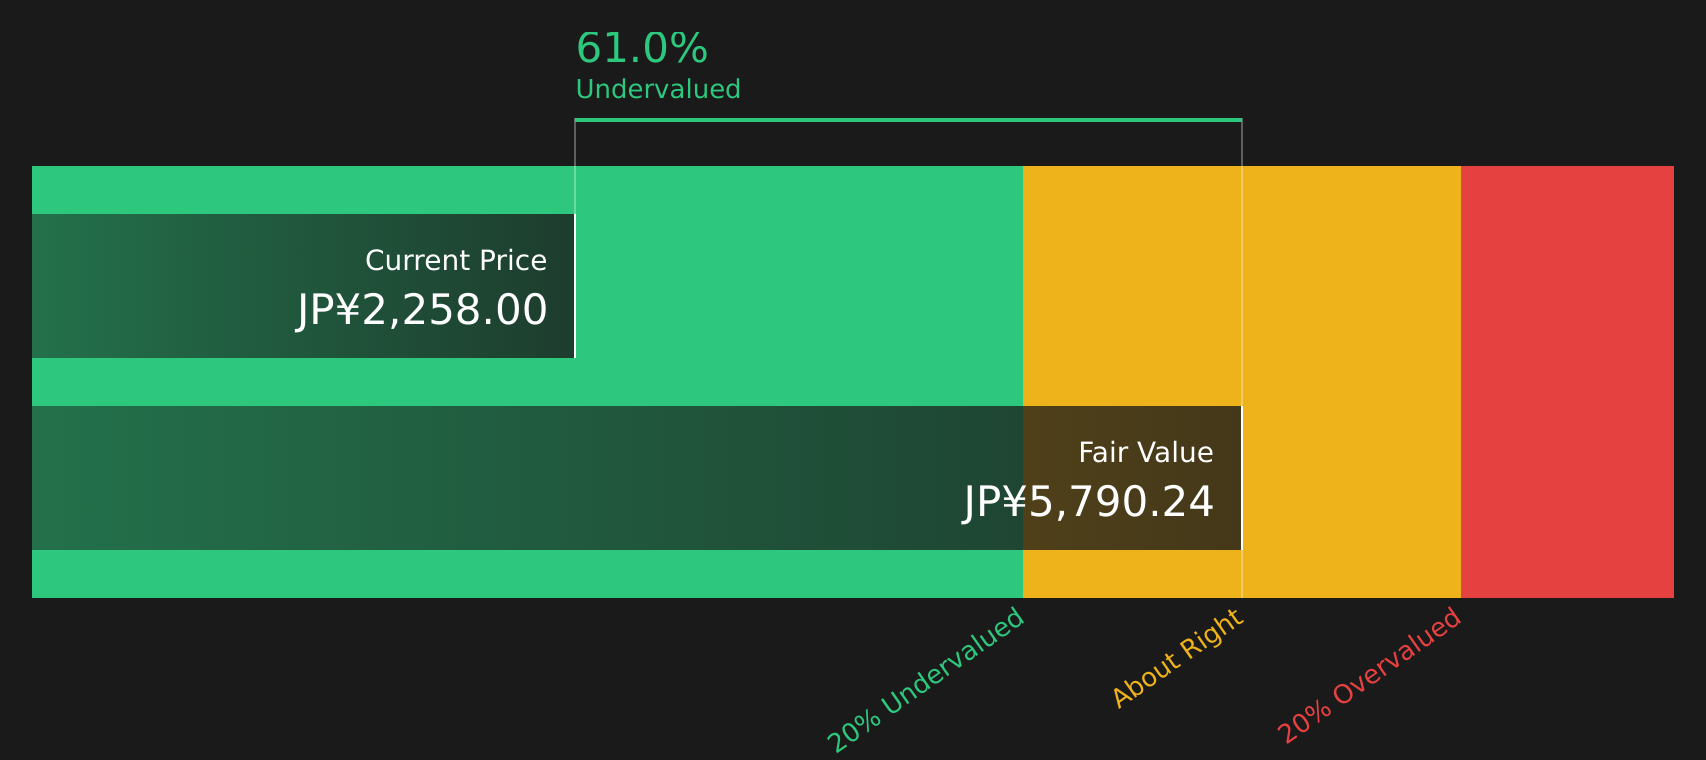
Simply Wall St performs a discounted cash flow (DCF) on every stock in the world every day (check out Aisin for example). We show the entire calculation in full. You can track the result in your watchlist or portfolio and be alerted when this changes, or use our stock screener to discover 19 high quality undervalued stocks. If you save a screener we even alert you when new companies match - so you never miss a potential opportunity.
Next Steps
Does this mix of value signals and flagged risks around Aisin leave you confident or cautious? Act while the data is fresh and form your own view by weighing the 3 key rewards and 1 important warning sign
Looking for more investment ideas beyond Aisin?
If Aisin has sharpened your focus, now is the right time to widen your search and compare different opportunities before the next round of earnings resets expectations again.
Use the Simply Wall Street Screener to pressure test your thesis and line up fresh ideas that match the risk and return profile you actually want.
- Target stability first by checking companies that appear resilient on key financial metrics with the 58 resilient stocks with low risk scores
- Hunt for value opportunities that look attractively priced relative to fundamentals using the 19 high quality undervalued stocks
- Spot stocks where income is front and center by reviewing payout potential with the 49 dividend fortresses
This article by Simply Wall St is general in nature. We provide commentary based on historical data and analyst forecasts only using an unbiased methodology and our articles are not intended to be financial advice. It does not constitute a recommendation to buy or sell any stock, and does not take account of your objectives, or your financial situation. We aim to bring you long-term focused analysis driven by fundamental data. Note that our analysis may not factor in the latest price-sensitive company announcements or qualitative material. Simply Wall St has no position in any stocks mentioned.
Have feedback on this article? Concerned about the content? Get in touch with us directly. Alternatively, email editorial-team@simplywallst.com