
3 Top European Dividend Stocks To Watch
As the European market experiences a positive shift, with the STOXX Europe 600 Index reaching new highs and major indices like Germany's DAX and France's CAC 40 showing significant gains, investors are increasingly looking towards stable opportunities amidst fluctuating economic conditions. In this environment, dividend stocks offer a reliable income stream, making them an attractive option for those seeking stability and potential growth in their investment portfolios.
Top 10 Dividend Stocks In Europe
| Name | Dividend Yield | Dividend Rating |
| Zurich Insurance Group (SWX:ZURN) | 4.12% | ★★★★★★ |
| Telekom Austria (WBAG:TKA) | 4.17% | ★★★★★★ |
| Swiss Re (SWX:SREN) | 4.74% | ★★★★★★ |
| Rubis (ENXTPA:RUI) | 6.17% | ★★★★★★ |
| Revenio Group Oyj (HLSE:REG1V) | 3.44% | ★★★★★☆ |
| Naturgy Energy Group (BME:NTGY) | 6.18% | ★★★★★☆ |
| Iren (BIT:IRE) | 5.45% | ★★★★★★ |
| Hannover Rück (XTRA:HNR1) | 5.02% | ★★★★★★ |
| Edel SE KGaA (XTRA:EDL) | 6.28% | ★★★★★★ |
| Cembra Money Bank (SWX:CMBN) | 5.15% | ★★★★★★ |
Click here to see the full list of 193 stocks from our Top European Dividend Stocks screener.
We're going to check out a few of the best picks from our screener tool.
TKH Group (ENXTAM:TWEKA)
Simply Wall St Dividend Rating: ★★★★☆☆
Overview: TKH Group N.V. operates in the automation and electrification sectors with a market cap of €1.79 billion.
Operations: TKH Group N.V. generates revenue from its Smart Vision Systems (€522.65 million), Smart Connectivity Systems (€728.83 million), and Smart Manufacturing Systems (€522.62 million) segments.
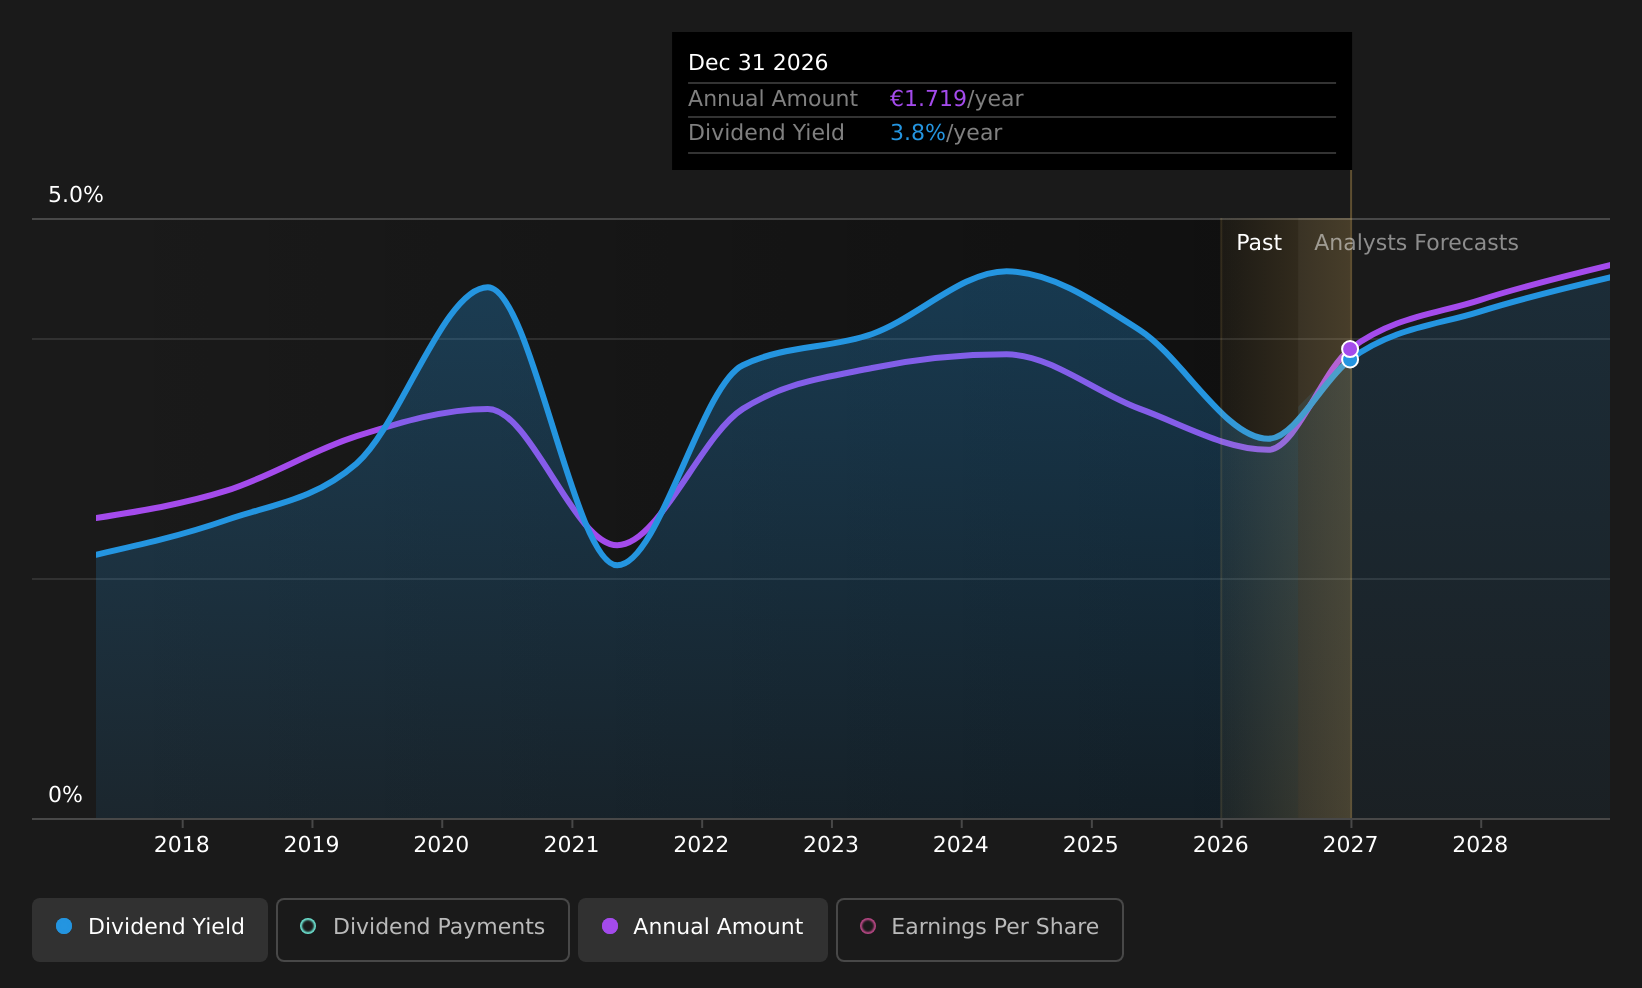
Dividend Yield: 3%
TKH Group's dividend yield of 3% is below the top quartile in the Dutch market. While dividends have grown over the past decade, they have been unreliable and volatile, with significant annual drops. The payout ratio of 57.1% suggests dividends are covered by earnings, but a cash payout ratio of 86.6% indicates potential strain on cash flows. Despite trading at a discount to its fair value estimate, high debt levels and large one-off items affect financial stability.
- Click here to discover the nuances of TKH Group with our detailed analytical dividend report.
- The analysis detailed in our TKH Group valuation report hints at an deflated share price compared to its estimated value.
KBC Group (ENXTBR:KBC)
Simply Wall St Dividend Rating: ★★★★☆☆
Overview: KBC Group NV is a financial services company offering banking, insurance, and asset management services in Belgium, Bulgaria, the Czech Republic, Hungary, and Slovakia with a market cap of €50.66 billion.
Operations: KBC Group NV generates revenue from its Belgium Business (€7.12 billion), Czech Republic Business (€2.57 billion), International Markets in Hungary (€1.24 billion), Bulgaria (€869 million), and Slovakia (€562 million).
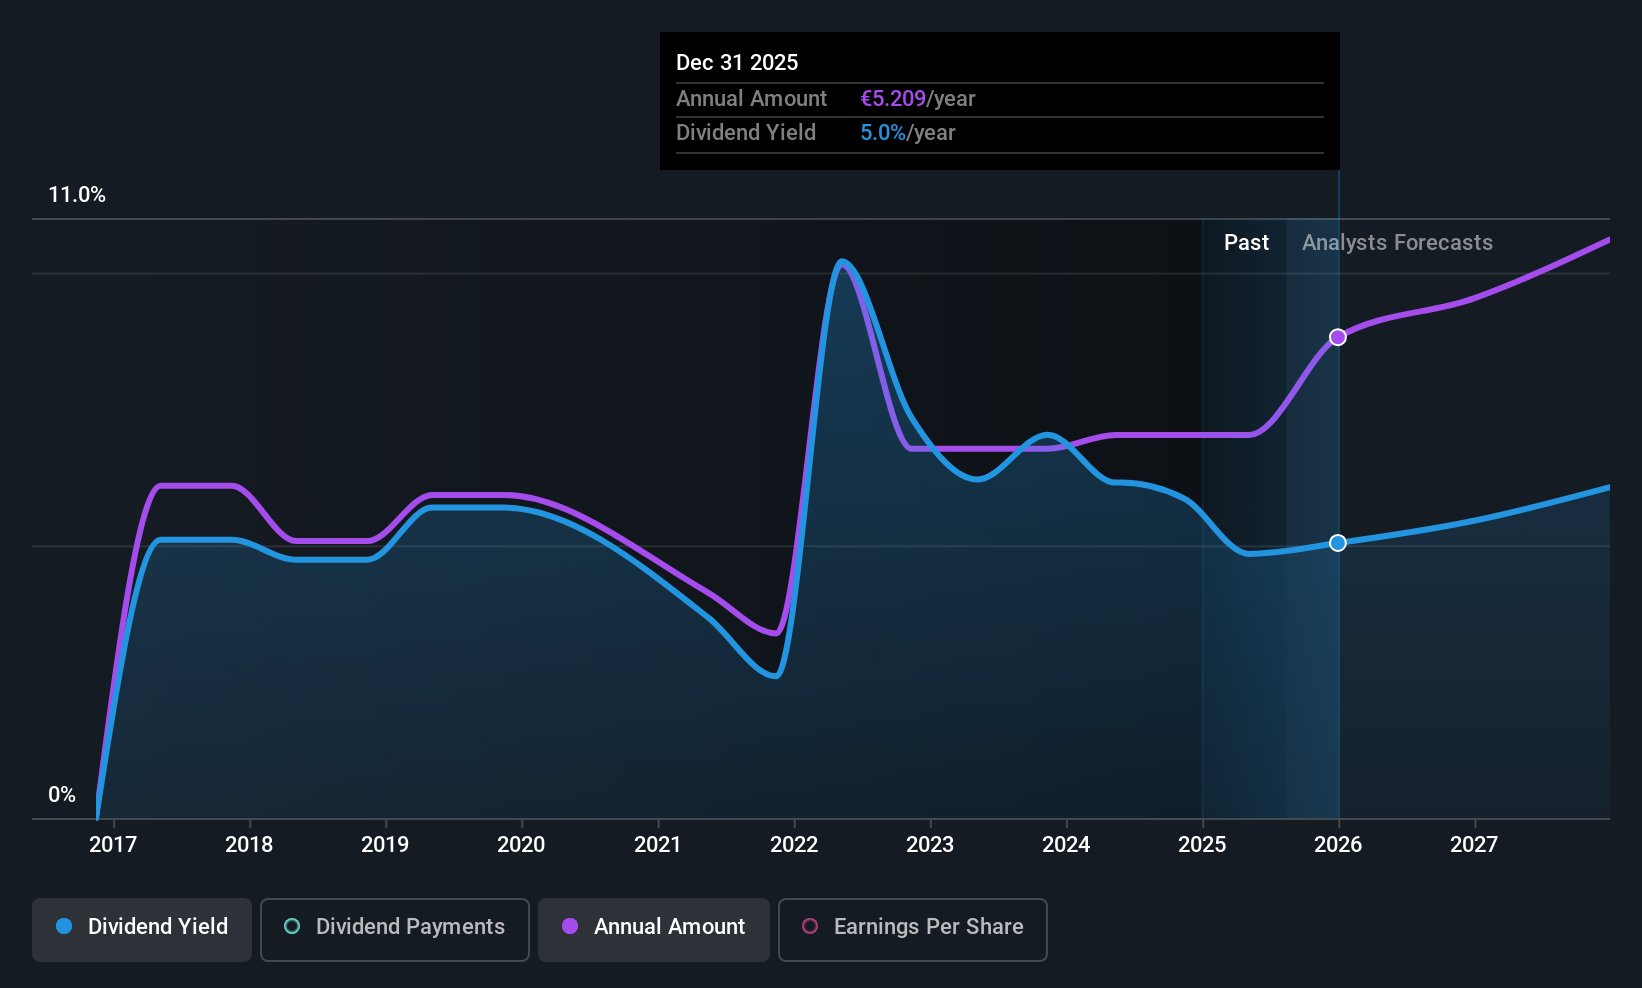
Dividend Yield: 4%
KBC Group's dividend yield of 3.99% is lower than the top quartile in Belgium. Although dividends have increased over the past decade, they remain volatile and unreliable. The payout ratio of 58.6% indicates dividends are covered by earnings, with a forecasted coverage of 63.3% in three years, suggesting sustainability despite past instability. Recent executive changes include Kris Vervaet's appointment as CIO, highlighting ongoing digital transformation efforts within KBC Group amidst its financial activities.
- Take a closer look at KBC Group's potential here in our dividend report.
- Insights from our recent valuation report point to the potential undervaluation of KBC Group shares in the market.
Asseco Poland (WSE:ACP)
Simply Wall St Dividend Rating: ★★★★☆☆
Overview: Asseco Poland S.A. is a global software producer and distributor with a market capitalization of PLN17.23 billion.
Operations: Asseco Poland S.A.'s revenue is primarily derived from its segments: Asseco Poland with PLN2.36 billion, Formula Systems contributing PLN10.11 billion, and Asseco International generating PLN4.71 billion.
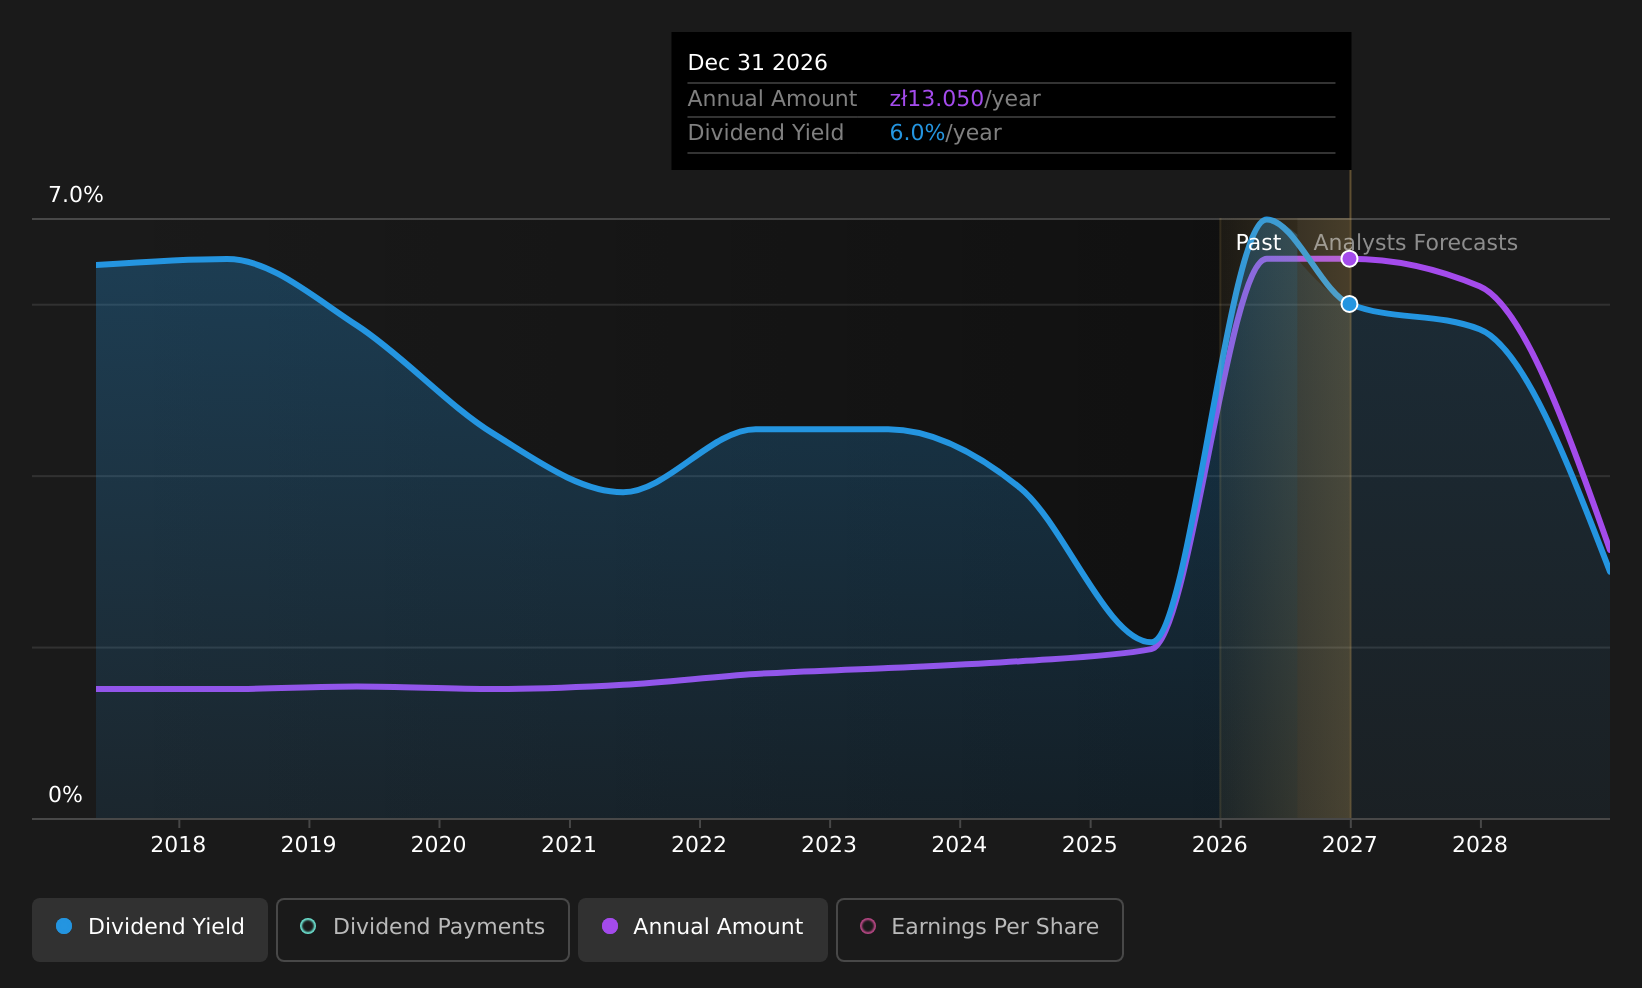
Dividend Yield: 6.1%
Asseco Poland's dividend yield of 6.1% is below the top tier in Poland, with dividends having grown steadily over the past decade. However, its high payout ratio of 135.2% indicates dividends are not well covered by earnings, although cash flows provide some coverage. Recent earnings showed significant growth with a net income rise to PLN 228.4 million for Q1 2026 from PLN 136.2 million a year earlier, reflecting strong revenue performance but potential sustainability concerns for future dividends.
- Click to explore a detailed breakdown of our findings in Asseco Poland's dividend report.
- Our valuation report unveils the possibility Asseco Poland's shares may be trading at a discount.
Summing It All Up
- Embark on your investment journey to our 193 Top European Dividend Stocks selection here.
- Already own these companies? Bring clarity to your investment decisions by linking up your portfolio with Simply Wall St, where you can monitor all the vital signs of your stocks effortlessly.
- Streamline your investment strategy with Simply Wall St's app for free and benefit from extensive research on stocks across all corners of the world.
Contemplating Other Strategies?
- Explore high-performing small cap companies that haven't yet garnered significant analyst attention.
- Fuel your portfolio with companies showing strong growth potential, backed by optimistic outlooks both from analysts and management.
- Find companies with promising cash flow potential yet trading below their fair value.
This article by Simply Wall St is general in nature. We provide commentary based on historical data and analyst forecasts only using an unbiased methodology and our articles are not intended to be financial advice. It does not constitute a recommendation to buy or sell any stock, and does not take account of your objectives, or your financial situation. We aim to bring you long-term focused analysis driven by fundamental data. Note that our analysis may not factor in the latest price-sensitive company announcements or qualitative material. Simply Wall St has no position in any stocks mentioned.
Have feedback on this article? Concerned about the content? Get in touch with us directly. Alternatively, email editorial-team@simplywallst.com