
Kerui Real Estate Research: In January-July, the cumulative transaction area of newly built commercial residential homes in 50 key cities across the country fell 10.9% year-on-year, and the total market volume continued to bottom out
The Zhitong Finance App learned that Kerry Real Estate Research published an article stating that from January to July 2026, the transaction area of newly built commercial housing in 50 key cities across the country was about 82.99 million square meters, a cumulative year-on-year decrease of 10.9%, and the total market volume continued to bottom out. However, as the total volume has shrunk, the structure has already been rewritten. The transaction was split by area segment: the share of demand has declined, and the share of improvements has increased, forming the clearest structural line in the past three years.
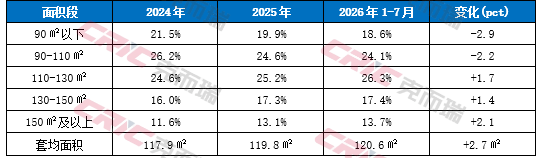
Judging from the proportion of units sold in each area segment, the improvement side has been steadily expanding: 110-130 square meters has always been the largest single transaction area, accounting for about 25%-26%, reaching 26.3% in 2026; the share of the 150 square meter and above area increased the fastest, jumping from 11.6% to 13.7%, increasing 2.1 pcts in two years. Overall, the proportion of units over 110 square meters continued to rise, from 52.3% in 2024 to 57.4% in 2026, with a cumulative increase of 5.1 pcts over two years.
Corresponding to this, the share of immediate demand continued to shrink: the area area below 90㎡ fell from 21.5% to 18.6%, 90-110㎡ fell from 26.2% to 24.1%, falling by about 5.1 pct in total over two years, which basically corresponds to the increase in the share of 110㎡ or more, and the “basic market” has narrowed markedly.
Table 1 Changes in the share of units sold by area in 50 key cities across the country
Data source: CRIC China Real Estate Decision Consulting System.
The dual logic of demand migration and passive increase, and the proportion of large apartments increasing
It should be pointed out that the increase in the share of large units includes two effects: one is a shift in actual demand preferences, that is, buyers actively choose products with a larger area; the other is that the deeper decline in small apartment transactions has led to a passive increase in the share of large units.
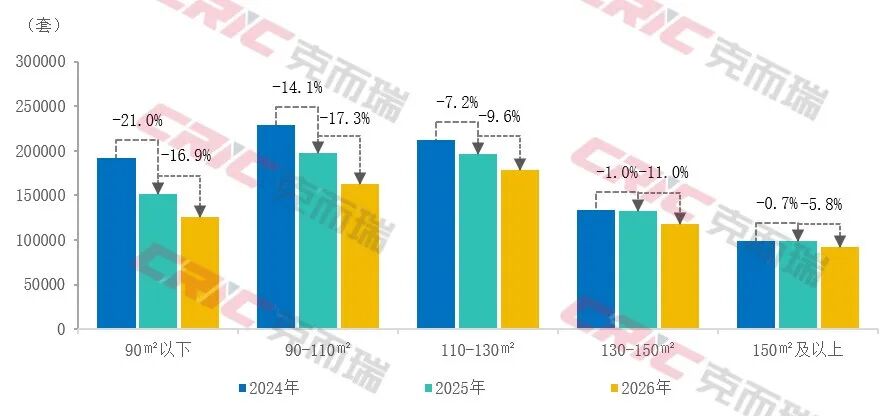
In absolute terms, from 2024 to 2026, the number of newly built commercial residential units sold in 50 cities across the country fell from 867,000 to 678,000 units, a cumulative decrease of 21.8%. Among them, 90 square meters or less fell from 192,000 units to 126,000 units, the biggest drop; followed by 90-110 square meters, falling from 230,000 units to 163,000 units, a decrease of about 29.0%; while 150 square meters and above dropped the smallest, from 99,000 units to 93,000 units, a decrease of only 6.4%; 130-150 square meters fell from 134,000 units to 118,000 units, a decrease of about 11.9%; 110-130 square meters fell from 212,000 units to 178,000 units, a decrease of about 16.1%.
Figure 1 Changes in the cumulative number of units sold in each area segment in 50 key cities across the country from January to July
Data source: CRIC China Real Estate Decision Consulting System.
It can be seen that the decline in newly needed units is significantly greater than that of improved units, which is an important reason for the increase in the share of large units. However, at the same time, the absolute decline for large apartments above 150 square meters also reflects the resilience of demand for high-end improvements to a certain extent. In the downward cycle of the market, demand groups are affected by factors such as falling income expectations and increased employment pressure, and their willingness and ability to buy homes shrinks more clearly; while improved buyers often have stronger economic strength and more stable income expectations, they still have strong demand for replacement and upgrading with policy support.
Price mapping “quality pricing power”, high-end improvements and premiums are remarkable
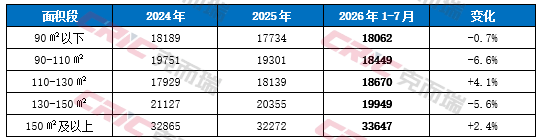
Structural changes are simultaneously evident in the price dimension. Judging from the changes in the average transaction price within each area segment, from 2024 to 2026, the price trend of products in different area segments showed clear differentiation. The average price for small apartments below 90㎡ dropped slightly from 18,189 yuan/square meter to 18062 yuan/square meter, which was basically the same; the average price within the 110-130㎡ segment rose from 17,929 yuan/㎡ to 18,670 yuan/㎡, up 4.1%; the average price within the 150㎡ and above segment rose from 32,865 yuan/㎡ to 33,647 yuan/㎡, up 2.4%. The average price in the 90-110㎡ segment fell from 19751 yuan/㎡ to 18,449 yuan/㎡, which was the heaviest dragged down by the decline in purchasing power demand, with the biggest drop; while 130-150㎡ was an intermediate improvement, although there was some replacement support, compared to 150 square meters and above (supported by scarce/luxury properties), product homogenization was high, and supply was concentrated in second-tier cities (accounting for about 65% of this total volume), which is also under great pressure in exchange for price.
Table 2 Changes in average transaction prices in each area segment of 50 key cities in the country (yuan/square meter)
Data source: CRIC China Real Estate Decision Consulting System.
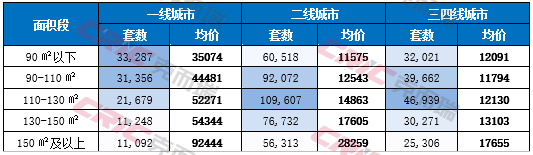
Judging from the price gradients of each area segment, the average price fault for products of 150 square meters and above is leading, more than 80% higher than the area area of 90 square meters. Among them, Tier 1 and 2 cities are the most prominent, all reaching more than 2 times. Improved products, especially large apartment products, are becoming the main carrier of “quality pricing power” for housing enterprises.
This is highly compatible with the “good house” policy orientation: when it just needed to shrink and replace and improve to become the main force, housing enterprises skewed product power, housing acquisition rates, bidding, and community services towards large units, and the price gradient was widened as a result.
Table 3 Energy-level transaction performance for each area segment in key 50 cities from January to July 2026 (units, yuan/square meter)
Data source: CRIC China Real Estate Decision Consulting System.
“Ladder improvement” for first-tier cities, “one-step implementation” and “final transformation” for second-tier, third-tier and fourth-tier cities
Looking at the energy division level, the improvement paths of the various tier cities are clearly divided: the first tier shows “stepwise improvement,” while the second tier and third tier and fourth tier tend to be “one-step in place” or even “final transformation,” but the momentum for second-tier improvements is far stronger than the third and fourth tier.
First-tier cities: Under the constraints of high housing prices, they showed stepwise replacement improvements.
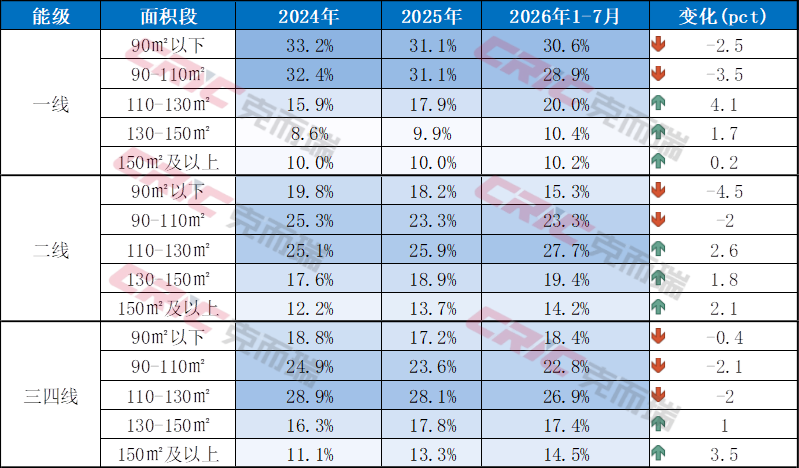
There is a significant difference between the new housing transaction structure in first-tier cities and second-tier and third-tier cities. In 2026, the share of transactions in areas above 110 square meters was only 40.5%, far lower than that of second-tier cities (61.4%) and third-tier and fourth-tier cities (58.8%); 90 square meters or less accounted for 30.6%, and 90-110 square meters accounted for 28.9%, accounting for a total share of 59.5%, still dominating the market. This structural characteristic is closely related to the market environment of high housing prices and high population density in first-tier cities.
However, it is worth noting that the trend of improvement in first-tier cities is accelerating. The share of 110 square meters or more in first-tier cities increased by 6.0 pct in two years. Almost all of the increases came from the 110 to 130 square meters and 130 to 150 square meters. In particular, the proportion of 110-130 square meters increased from 15.9% to 20.0%, an increase of 4.1 pct, which is the biggest increase among all energy levels. The proportion of the area of 150 square meters and above has remained stable at about 10% over a long period of time. This indicates that the first-tier customer base is not an overall “luxury home”, but rather that high housing price thresholds are crowding out first-time buyers and newly-needed customers (shifting to second-hand and rental). The remaining demand for new housing is mainly based on “selling small, buying big” replacement households, and demand is moving up in a step-wise manner.
Second-tier cities: The trend of improvement is the most prominent, and the characteristic of “one step in place” is remarkable.
Second-tier cities are the regions with the most significant improvements in the new housing transaction structure. The share of transactions in the area of 110 square meters or more increased by 6.5 pct in two years, higher than the national average (5.1 pct); among them, the share of 150 square meters and above rose from 12.2% to 14.2%, an increase of 2.1 pct. However, the proportion of 90 square meters or less has plummeted by 4.5 pct in the cycle, indicating that small transition units are being directly skipped. Newly purchased households choose large areas for the first time or main buyers, with remarkable “one step in place” characteristics; the introduction of superimposed talents has brought about high purchasing power groups, small housing stock has spawned replacement upgrades, drastic relaxation of purchase restrictions and lowering the threshold, etc., and demand for improved home purchases has been released more fully.
Third- and fourth-tier cities: Large apartments account for a high proportion, but the increase is limited.
Third- and fourth-tier cities showed the characteristics of “large apartments account for a high proportion but the increase is limited.” The share of the area of 110 square meters or more (58.8%) and the share of 150 square meters and above (14.5%) are both high, but only 2.5 pct increased in two years, far lower than the second-line (6.5 pct) and first-line (6.0 pct). Of these, the proportion of 110-130 square meters even fell by 2.0 pct. This is related to the low level of housing prices and the fact that purchasing power can support a large area; however, the weak increase stems from the release of more demand for early improvements and insufficient new demand due to population outflow. The overall market is mainly based on stock replacement, and structural changes are relatively slow.
Table 4. Percentage and changes in the number of units sold in each area segment of the energy level
Triple factor resonance: structural improvement is a long-term trend
Improvements are not short-term cyclical fluctuations, but rather the result of long-term resonance of the three factors of policy, supply, and demand.
Policy side: supply-side loosening and demand-side threshold reduction will jointly drive improvement and transformation.
In 2024, the Ministry of Housing and Construction clearly proposed the development direction of building “good houses” and continued to promote it, liberalize planning and design restrictions on floor height, housing acquisition rate, floor area ratio, and fourth-generation housing from the product supply side, and remove institutional barriers to the implementation of large-scale high-quality housing. The demand side continues to introduce a package of optimization policies, and fully implement measures such as unsolicited housing, lower down payments, interest rates, and optimized purchase restrictions to significantly lower the threshold for improving the home purchase; local policies have relaxed purchase restrictions for families with many children and talents on the first line, completely untie the second tier, and promote replacement with subsidy and contract taxes to jointly support the replacement chain.
Supply side: Housing enterprises switch to an “improvement+high-end” track to increase the proportion of large units at the source.
In the downturn cycle, customers with improved products have stronger purchasing power, lower price sensitivity, and better reduction and profit performance, driving housing enterprises to increase their product power and area segment; at the same time, improved second-hand housing circulation makes “sell one buy one” smoother, and the share of low floor area ratio plots in core cities has increased, and the supply of large apartments is also supported from the land side.
Demand side: After the housing shortage problem was solved, “living in good housing” became mainstream, and replacement windows were opened centrally.
In 2026, the per capita housing area of urban residents has exceeded 40 square meters, and demand is shifting from “whether there is” to “good or not”; the last round of the peak demand for housing purchases (2015-2018) followed an 8-10 year replacement cycle, and is currently entering a centralized release period for housing replacement upgrades.