Precious metals are on the rise across the board! The increase in gold prices this week may be the best since January. Silver's “cup and handle breakthrough” ignites more room for imagination
The Zhitong Finance App learned that on Friday (August 7), international gold prices rose more than 1%, and this week is expected to record the biggest weekly increase since January this year. The driving factor is that market expectations of the Federal Reserve's interest rate hike have cooled down, while inflation concerns related to the US-Iran peace agreement have been mitigated. Meanwhile, investors are waiting for the US non-farm payrolls data for July to be released. At the same time, analysts said that a “breakthrough in silver's technical cup handle” is also expected to ignite hopes for a bull market.
As of press release, spot gold was reported at $4,318.94 per ounce, an intraday increase of 1.85%. The price of gold hit a seven-week high on Thursday, and the cumulative increase this week has exceeded 6.6%. US gold futures rose 1.9% at the same time to $4,380.90 an ounce.
The short-term trend of gold prices anchors the Federal Reserve's policy expectations
Kyle Rodda (Kyle Rodda), senior financial market analyst at Capital.com, said: “The current price of gold is essentially a derivative of the Federal Reserve's policy expectations. The market's implied probability of interest rate hikes has declined marginally, compounded by the market's belief that Chairman Walsh may not be as hawkish as expected, and jointly push the price of gold higher.”
According to the Chicago Mercantile Exchange (CME) FedWatch tool, traders currently expect the probability that the Fed will raise interest rates in September to be 55%, which is a significant drop from 67% last week.
On the geopolitical side, US President Trump told reporters that he believes the war with Iran will soon end. Crude oil prices are likely to close down this week. Falling energy costs will help ease concerns about inflation, which in turn will prompt investors to reduce their bets on interest rate hikes. Although gold is viewed as an inflation-resistant asset, its appeal often declines in high interest rate environments because gold itself does not generate interest returns.
Non-agricultural data may become short-term inventory
The US Department of Labor will release the July non-farm payrolls report at 20:30 p.m. Beijing time on Friday.
Han Tan, chief market analyst at Bybit, stated, “If the US job market shows resilience again, the price of gold may take back some of this week's gains, and its 50-day moving average may provide technical support. And strong employment data will also add upward risk to the outlook for inflation and the Federal Reserve's interest rate.”
UBS (UBS), on the other hand, maintains a medium- to long-term bullish position, and the price of gold is expected to rise to $5,000 per ounce in the first half of 2027.
In terms of physical demand, as retail buyers chose to wait and see after the gold price rose to a high level of more than a month, India's gold discount margin increased this week; while gold activity in China, the largest consumer country, also cooled down.
As of press release, spot silver was reported at $64.37 per ounce, an intraday increase of 4.6%, platinum rose 2.4% to $1,770.15, and palladium rose 1.6% to $1,391.20. All three are expected to record weekly gains this week.
Silver's technical “cup handle breakthrough” ignites hopes for a bull market
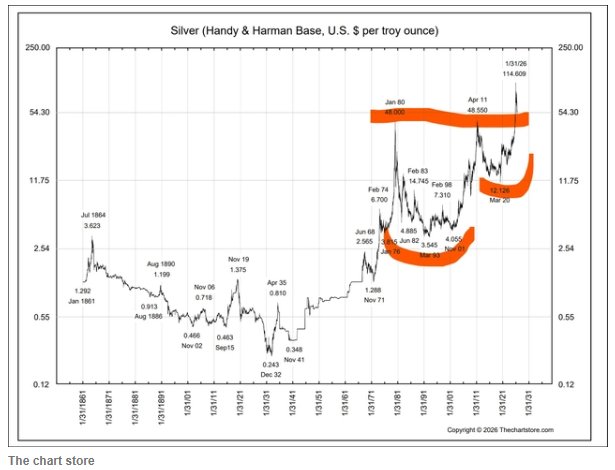
Renowned technical analyst Peter Brandt (Peter Brandt) recently said in a chart he released that silver has broken through its long-term “cup and handle” (cup and handle) pattern, which may indicate that the price will rise further.
Brandt called this pattern the “mother of the cup handle pattern,” and pointed out that a breakthrough has already occurred, and the price is currently at the stage of stepping back to confirm the breakthrough. He further asserted that the price of silver “will also rise sharply,” while stressing that the key question is when the next increase will begin.
The chart tracks Handy & Harman's silver spot price data since the 1860s, showing a decades-long pattern with long-term resistance concentrated around $48 per ounce — this region corresponds to the high of $48.00 in January 1980 and the peak of $48.55 recorded in April 2011.
The chart also shows that as of January 31, 2026, the price of silver had hit $114.609 per ounce. When publishing this chart, Brandt also quoted the price of silver futures contracts.