
What Do Cost of Carry Tables Tell Us Heading Into Fall Harvest?
At Barchart's 2026 Summer Road Show meetings in Omaha and Shakopee, Minnesota, I spent a good deal of time talking about Cost of Carry tables.
With the US heading into fall harvest, we can use these tables to evaluate which market to hold and which to sell, theoretically, when it comes to corn and soybeans.
In early August, the US soybean market has a more bullish long-term fundamental outlook, but things can and will change.
At the Barchart Summer Road Show event in Shakopee, Minnesota, after the talking had ended and the horse racing began (the event was held at Canterbury Park, appropriately enough) a gentleman came up and asked if I had written about the Cost of Carry tables I spent so much time talking about. I remembered him from last year’s meeting in Ames. He was interested enough in what I said then to ask if Barchart had charts showing the trend of the percent of calculated full commercial carry spreads cover. As of today, it is still a work in progress (though I have Excel files I post each week). I appreciate his continued interest in futures spreads, and my analysis of them. With the US 2026 fall harvest off and running, it’s time to take our annual look at what I like to call The Gamblers’ Secret. As Kenny Rogers’ famous character told us nearly 50 years ago (is that right?!), “You’ve got to know when to hold ‘em. Know when to fold ‘em. Know when to walk away and know when to run.” For those of you new to my analysis and commentary, let me interpret this for you. Market Rule #2 tells us, “Let the market dictate your action.” This includes deciding what crop to store after harvest (hold) and what crop to sell as harvest progresses (fold). How does the market “dictate” our actions, though? If commercial traders need cash supplies, we sell it to them. On the other hand, if those same commercial interests are indicating they do not need supplies to meet demand and are willing to pay you to NOT sell at this time, it’s best to listen.
This is where the aforementioned Cost of Carry tables come into play. As I often tell the various crowds I speak to, these tables are pages that I look at probably more than any other on my Barchart cmdtyView quote system. The cost of carry is the total cost, storage and interest, of holding grain in a commercial facility. The storage cost is generally stable (the exception being wheat which occasionally falls into the CME’s Variable Storage Rate program), while the interest rate usual changes fractionally each day (90-day average SOFR + 2.2125%). The table does the math behind the scenes and gives you what percent of total cost of carry the spread is covering each day (I look at daily, weekly, and monthly closes).
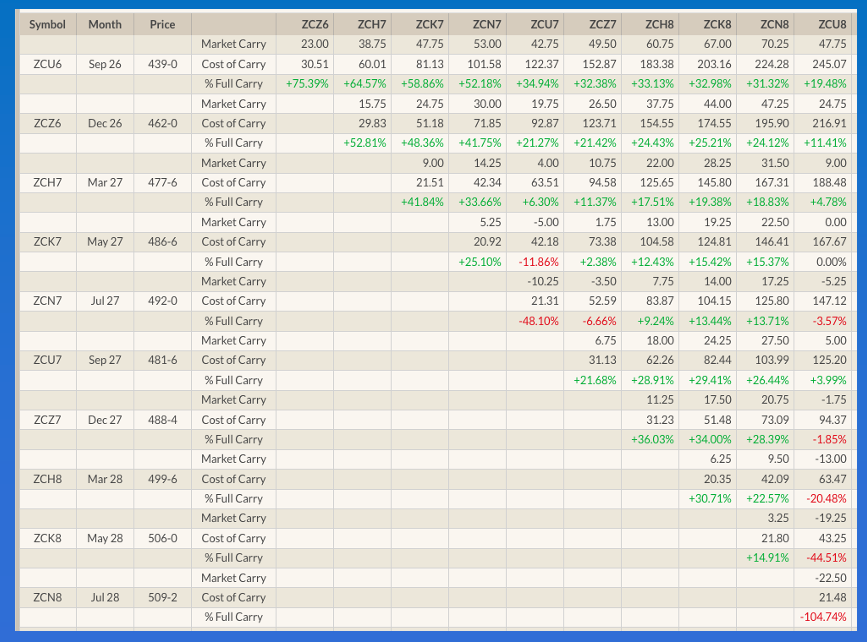
Let’s take a look at last Friday’s corn cost of carry table.
- The September-December futures spread closed at a carry of 23.0 cents and covered 75% calculated full commercial carry (cfcc).
- The numbers for the December-March were 15.75 cents and 53%
- March-May: 9.0 cents and 42%
- May-July: 5.25 cents and 25%
I know, that’s a lot of numbers. The one’s we need to focus on are the percent of full commercial carry covered. Many decades ago, in my role as a grain merchandiser (and not a very good one at that), a logistics manager for one of the terminals I sold to taught me to track these percentages. The idea at the time was grain merchandisers started rolling short futures hedges forward (buy back the nearby short hedges and sell deferred futures) when the spread covered 70% or more calculated full commercial carry. Using this level, I created my own scale: 70% or more means the commercial outlook is increasingly bearish, 30% or less means the commercial outlook is increasingly bullish. (And as we all remember from Dr. Seuss’ Horton Hears a Who, an inverse is an inverse no matter how small. And an inverse in a storable commodity (grains, softs, and energies) is almost always bullish (note the use of the Vodka Vacuity[i])). Lastly, percentages less than 70% and greater than 30% are varying degrees of neutral.
With this in mind, what do we know about the corn market as of the close Friday, August 7?
- The immediate-term September-December spread is bearish[ii]. This is likely due to leftover old-crop supplies combined with new-crop bushels come in from early harvest around the fringes of major US growing areas.
- The Dec-March spread covered a neutral level[iii] of calculated full commercial carry. This tells us the commercial side is comfortable with supplies in relation to demand during the bulk of the US harvest.
- The March-May was also neutral but leaning more to the bullish side than the December-March. This indicates once newly harvested corn bushels are tucked away for the winter in the US, supplies are expected to tighten in relation to demand, but not dramatically so.
- The May-July spread is bullish. This indicates the commercial side is concerned about supplies in relation to demand during the spring/early summer of 2027.
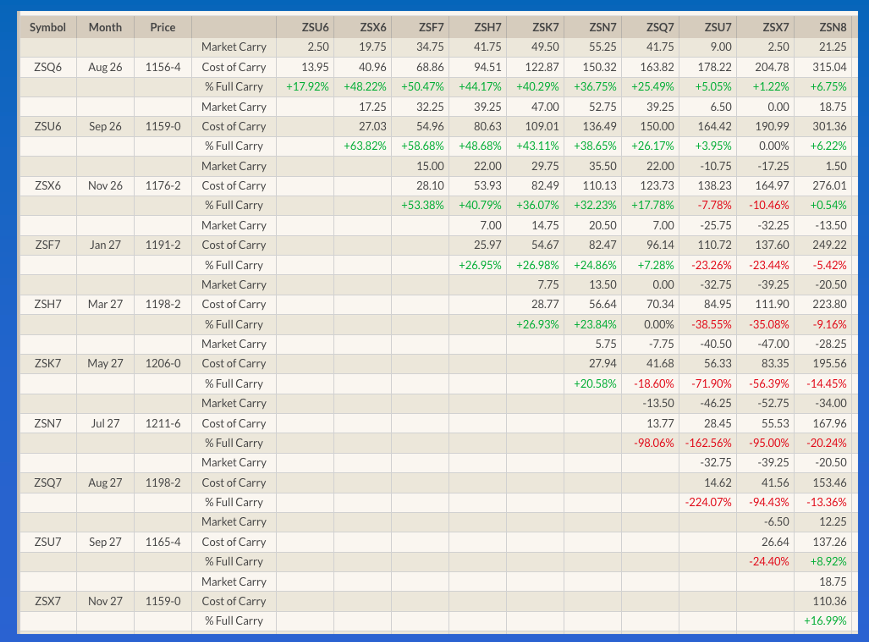
Now let’s look at the soybean cost of carry table.
- The November-January closed at a carry of 15.0 cents and covered a neutral 53%.
- The January-March closed at a carry of 7.0 cents and covered a bullish 27%.
- The March-May closed at a carry of 7.75 cents and also covered 27%.
- The May-July closed at a carry of 5.75 cents and covered 21%.
My analysis of this set of spreads is that US merchandisers are again comfortable with whatever the 2026 harvest turns out to be. However, once the gut slot of harvest has come and gone, the commercial view quickly changes to one of concern over supplies in relation to demand. There are a couple possible reasons:
- US domestic crush continues to run at a red-hot pace.
- Brazil’s 2027 crop runs into weather problems, possibly forcing the world’s largest buyer (China) to come to the US for increased secondary supplies.
That being said, here’s where the trend of percent of cfcc covered becomes interesting. Again, as of Friday, August 7, we are seeing the spreads take an abrupt downturn, meaning a larger percent was covered the past two weeks. While still bullish, the three deferred spreads are not AS bullish as they were in late July. Why? Weather across the US has improved, meaning more production is possible and a longer stretch into the spring of 2027 when there should be adequate supplies to meet demand.
So, what does this tell a US producer when it comes to playing his fall harvest hand? As is most often the case, there are at least two ways of looking at it. Let’s start with the textbook and say the producer in question has nearly 100% of her expected production hedged in either December corn (ZCZ26) or November soybean futures (ZSX26). (Yes, I know the likelihood of this happening is about as rare as a unicorn being eaten by the Loch Ness Monster during a full moon on the night of February 30, but let’s pretend anyway.)
- Given both the Dec-March corn spread and November-January soybean futures spread are nearly even, the March-May futures spreads hold the key. Here we see the soybean spread is far more bullish than corn. Additionally, if the corn market does see a Down Escalator Simulator develop, then it’s possible the March-May could follow a similar path as the September-December and December-March. Granted, deferred soybean spreads are trending down, but they have a ways to go before they aren’t bullish, at least as of this writing.
- Therefore, in this hypothetical situation, the market is saying hold short hedges of December futures (to roll forward at a later date) and fold (sell cash) and cover short hedges in November futures. (Those with more of a gambling streak might cover short November hedges then hold cash bushels in storage based on the bullish deferred futures spreads. From a seasonal analysis point of view, this makes sense. But that’s a story for another day.)
The second way of looking at the question is on the far other end of the spectrum. Let’s say the US producer has none (or very little) of his expected 2026 production hedged in the futures market (or forward contracted, just to make the conversation a bit more difficult). How does this hand get played?
- If we look at the Cost of Carry tables again, we see the entirety of the 2026-2027 corn forward curve (set of futures spreads), reflected in the Dec-July spread, covered a neutral 42% where the November-July soybean spread covered a bullish leaning 32%. While the commercial view can and will change, as of now the marketing plan could be to sell corn at harvest and hold soybeans in anticipation of a more bullish fundamental situation next spring.
- However, and this is why I want to devote an entire piece to seasonal analysis, the 5-year average moves of the National Cash Indexes show corn (ZCPAUS.CM) gains 24% from the fourth weekly close of September through the second weekly close of May. The soybean national cash index (ZSPAUS.CM) shows a 5-year gain of 18% from the third weekly close of October through the third weekly close of May. If, though, we see a similar supply and demand situation develop next marketing year as we saw this year, then the National Corn Index gained 16% from low weekly close to high weekly close while the National Soybean Index added as much as 27%.
- The 2026-27 corn forward curve is similar to what it covered the same week last year, 42% to 47%, while the soybean forward curve is much more bullish, 32% to 56%.
Before we sing the last refrain of The Gambler, “You never count your money when you’re sitting at the table. There’ll be time enough for counting, when the dealin’s done”, we need to keep one other key piece of wisdom in mind when it comes to ‘marketing plans’. As the philosopher Mike Tyson once said (and I am not being sarcastic when I say that, truly), “Everyone has a plan until they get punched in the face”. The markets will punch us in the face, or other areas, and we need to have the flexibility to roll with those punches. If not, then we’ll just be out of aces.
[i] The Vodka Vacuity: There are no Absolutes in market analysis.
[ii] Naturally, this reminds me of a story. Once upon a time the Editor in Chief of the newsroom took me to the office of the company president. The latter was an economist and was curious about my take that the stronger the carry in a storable commodities futures spread the more bearish the supply and demand situation was. His argument was the higher deferred price meant the market thought prices were going to go up over time. It was my opportunity to say to the president of the company, “You’re wrong, and let me tell you why”. Shortly after that I was made Senior Analyst.
[iii] This also sets the stage for what I call a Down Escalator Simulator. In other words, the deferred futures spread tends to follow the same track as the nearby spread. in the case of corn, this means the Dec-March spread could see its carry continue to strengthen until it too covers a bearish. Level of calculated full commercial carry.
On the date of publication, Darin Newsom did not have (either directly or indirectly) positions in any of the securities mentioned in this article. All information and data in this article is solely for informational purposes. For more information please view the Barchart Disclosure Policy here.