
Cigna (CI) Stock Looks Undervalued As It Raises Full Year Outlook
Cigna Group stock has delivered a 46.9% return over the past five years, yet based on current valuation checks it still screens as attractively priced rather than fully priced in. That mix of solid long term performance and a high value score raises the question of whether the recent share price is keeping up with the fundamentals.
- Over the last five years, Cigna Group has returned 46.9%, which points to steady value creation over a multi year holding period.
- Recent earnings strength and a raised outlook may support expectations for ongoing cash generation. At the same time, any slowdown in GLP 1 prescription growth or pressure on healthcare margins can influence what investors are prepared to pay for the stock.
- Cigna Group scores 6 of 6 on Simply Wall St's broader valuation checks, which suggests the stock looks undervalued across multiple measures according to the valuation scorecard.
For investors, the debate is whether Cigna Group's current share price already reflects this stronger outlook or still leaves a margin of safety based on today's valuation checks.
Find out why Cigna Group's 4.2% return over the last year is lagging behind its peers.
Does Cigna Group Look Undervalued on Earnings?
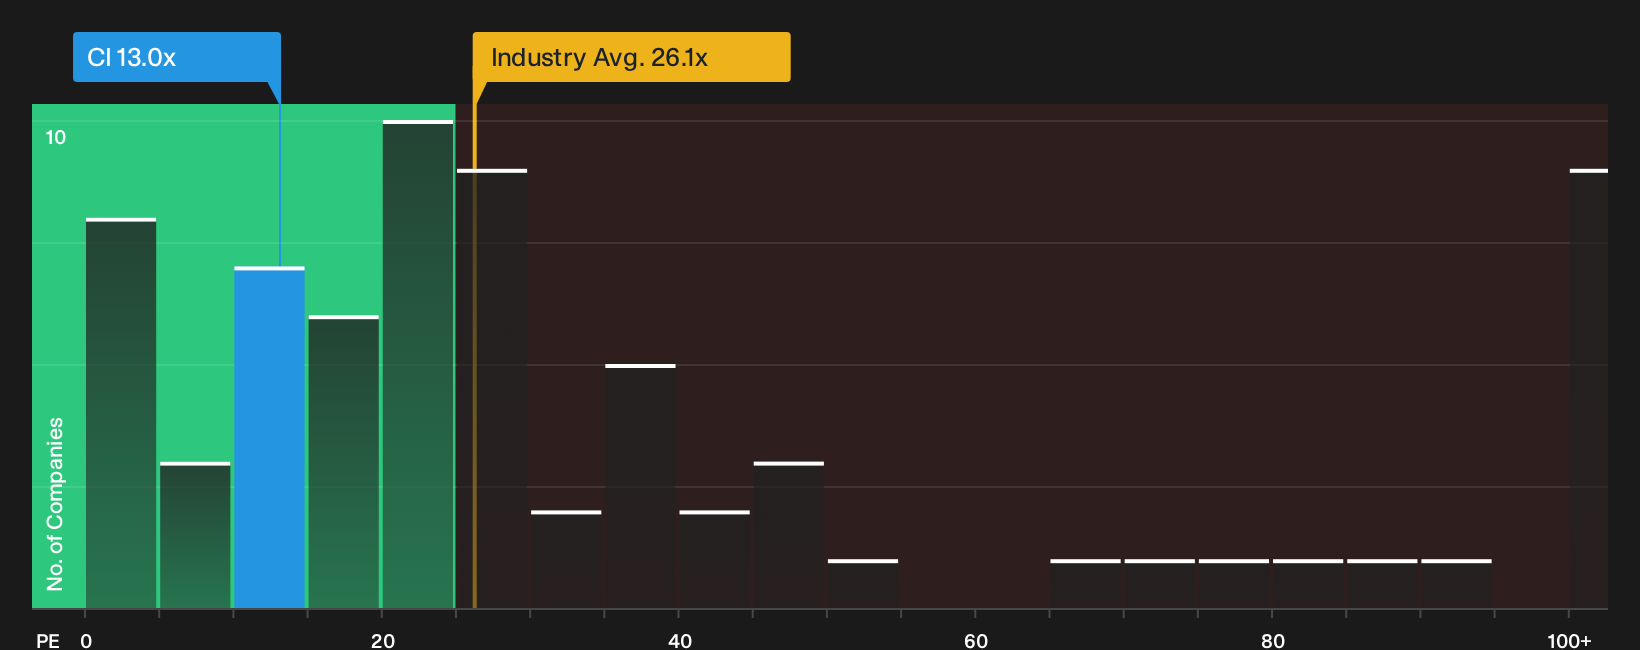
The P/E ratio is a useful measure for Cigna Group because earnings remain a key focus for investors in large diversified healthcare stocks. Today Cigna Group trades on a P/E of 11.6x. That compares with an average of 24.9x for the broader Healthcare industry and a peer group average of 32.1x, which places Cigna Group at a clear discount on this metric.
The fair P/E multiple implied by Simply Wall St’s model is 28.7x. This reflects factors such as Cigna Group’s margins, risk profile, scale and sector rather than relying only on broad industry averages. The company has raised its 2026 adjusted income from operations guidance to at least $30.45 per share. Even so, the current 11.6x P/E remains well below this fair multiple and below typical peers, which indicates that investors are not paying a high price for each dollar of earnings at present.
On the P/E multiple, Cigna Group stock currently appears undervalued relative to both sector benchmarks and the modelled fair ratio.
See what the numbers say about this price — find out in our valuation breakdown.
The Cigna Group Narrative: What Would Justify Today's Price?
Simply Wall St Narratives pick up where Cigna Group's valuation puzzle leaves off. They spell out which assumptions on Cigna Group's future growth, margins and earnings would need to hold for the stock to be worth materially more or less than today’s price. Each one frames fair value as a thesis about the business that you can revisit over time, rather than a one off snapshot, on the Community page.
Share a Narrative on Cigna Group to add your voice on whether the recent earnings strength and raised outlook for adjusted income from operations genuinely support today's valuation. You can present a clear, number-focused case and track how it holds up as new results and updates on GLP 1 prescription trends are released.
Do you think there's more to the story for Cigna Group? Head over to our Community to see what others are saying!
The Bottom Line
Cigna Group currently screens as undervalued on market multiples, with investors paying a relatively low P/E for each dollar of earnings compared with sector peers and the implied fair ratio. The key question is whether that discount reflects caution about GLP 1 prescription trends and healthcare margin pressure, or leaves genuine upside if recent earnings strength and guidance hold. For you, the crux is simple: decide whether the current concerns explain the gap in full, or whether Cigna Group's cash generation potential justifies a narrower discount over time.
This article by Simply Wall St is general in nature. We provide commentary based on historical data and analyst forecasts only using an unbiased methodology and our articles are not intended to be financial advice. It does not constitute a recommendation to buy or sell any stock, and does not take account of your objectives, or your financial situation. We aim to bring you long-term focused analysis driven by fundamental data. Note that our analysis may not factor in the latest price-sensitive company announcements or qualitative material. Simply Wall St has no position in any stocks mentioned.
Have feedback on this article? Concerned about the content? Get in touch with us directly. Alternatively, email editorial-team@simplywallst.com